

 Set up docs MCP
Vector is a high-performance, vendor-neutral observability data pipeline. It is commonly used to collect, transform, and route logs and metrics from a wide range of sources, and is especially popular for log ingestion due to its flexibility and low resource footprint.
When using Vector with ClickStack, users are responsible for defining their own schemas. These schemas may follow OpenTelemetry conventions, but they can also be entirely custom, representing user-defined event structures. In practice, Vector ingestion is most commonly used for logs, where users want full control over parsing and enrichment before data is written to ClickHouse.
This guide focuses on onboarding data into ClickStack using Vector for both ClickStack Open Source and Managed ClickStack. For simplicity, it doesn’t cover Vector sources or pipeline configuration in depth. Instead, it focuses on configuring the sink that writes data into ClickHouse and ensuring the resulting schema is compatible with ClickStack.
The only strict requirement for ClickStack, whether using the open-source or managed deployment, is that the data includes a timestamp column (or equivalent time field), which can be declared when configuring the data source in the ClickStack UI.
Sending data with Vector
The following guide assumes you have already created a Managed ClickStack service and recorded your service credentials. If you haven’t, follow the Getting Started guide for Managed ClickStack until promoted to configure Vector.
Create a database and table
Vector requires a table and schema to be defined prior to data ingestion.
First create a database. This can be done via the ClickHouse Cloud console.
In the example below, we use logs:
CREATE DATABASE IF NOT EXISTS logsCreate a table for your data. This should match the output schema of your data. The example below assumes a classic Nginx structure. Adjust accordingly to your data, adhering to schema best practices. We strongly recommend familiarizing yourself with the concept of Primary keys, selecting your primary key based on the guidelines outlined here.
CREATE TABLE logs.nginx_logs
(
    `time_local` DateTime,
    `remote_addr` IPv4,
    `remote_user` LowCardinality(String),
    `request` String,
    `status` UInt16,
    `body_bytes_sent` UInt64,
    `http_referer` String,
    `http_user_agent` String,
    `http_x_forwarded_for` LowCardinality(String),
    `request_time` Float32,
    `upstream_response_time` Float32,
    `http_host` String
)
ENGINE = MergeTree
ORDER BY (toStartOfMinute(time_local), status, remote_addr)Add ClickHouse sink to vector configuration
Modify your Vector configuration to include the ClickHouse sink, updating the inputs field to receive events from your existing pipelines.
This configuration assumes that your upstream Vector pipeline has already prepared the data to match the target ClickHouse schema, meaning that fields are parsed, named correctly, and typed appropriately for insertion. See the Nginx example below for a complete illustration of parsing and normalizing raw log lines into a schema suitable for ClickStack.
sinks:
  clickhouse:
    type: clickhouse
    inputs:
      - your_input
    endpoint: "<CLICKHOUSE_ENDPOINT>"
    database: logs
    format: json_each_row
    table: nginx_logs
    skip_unknown_fields: true
    auth:
      strategy: "basic"
      user: "default"
      password: "<CLICKHOUSE_PASSWORD>"
By default, we recommend using the json_each_row format, which encodes each event as a single JSON object per row. This is the default and recommended format for ClickStack when ingesting JSON data, and should be preferred over alternative formats such as JSON objects encoded as strings.
The ClickHouse sink also supports Arrow stream encoding (currently in beta). This can offer higher throughput but comes with important constraints: the database and table must be static, as the schema is fetched once at startup, and dynamic routing isn’t supported. For this reason, Arrow encoding is best suited for fixed, well-defined ingestion pipelines.
We recommend reviewing the available sink configuration options in the Vector documentation:
Navigate to the ClickStack UI
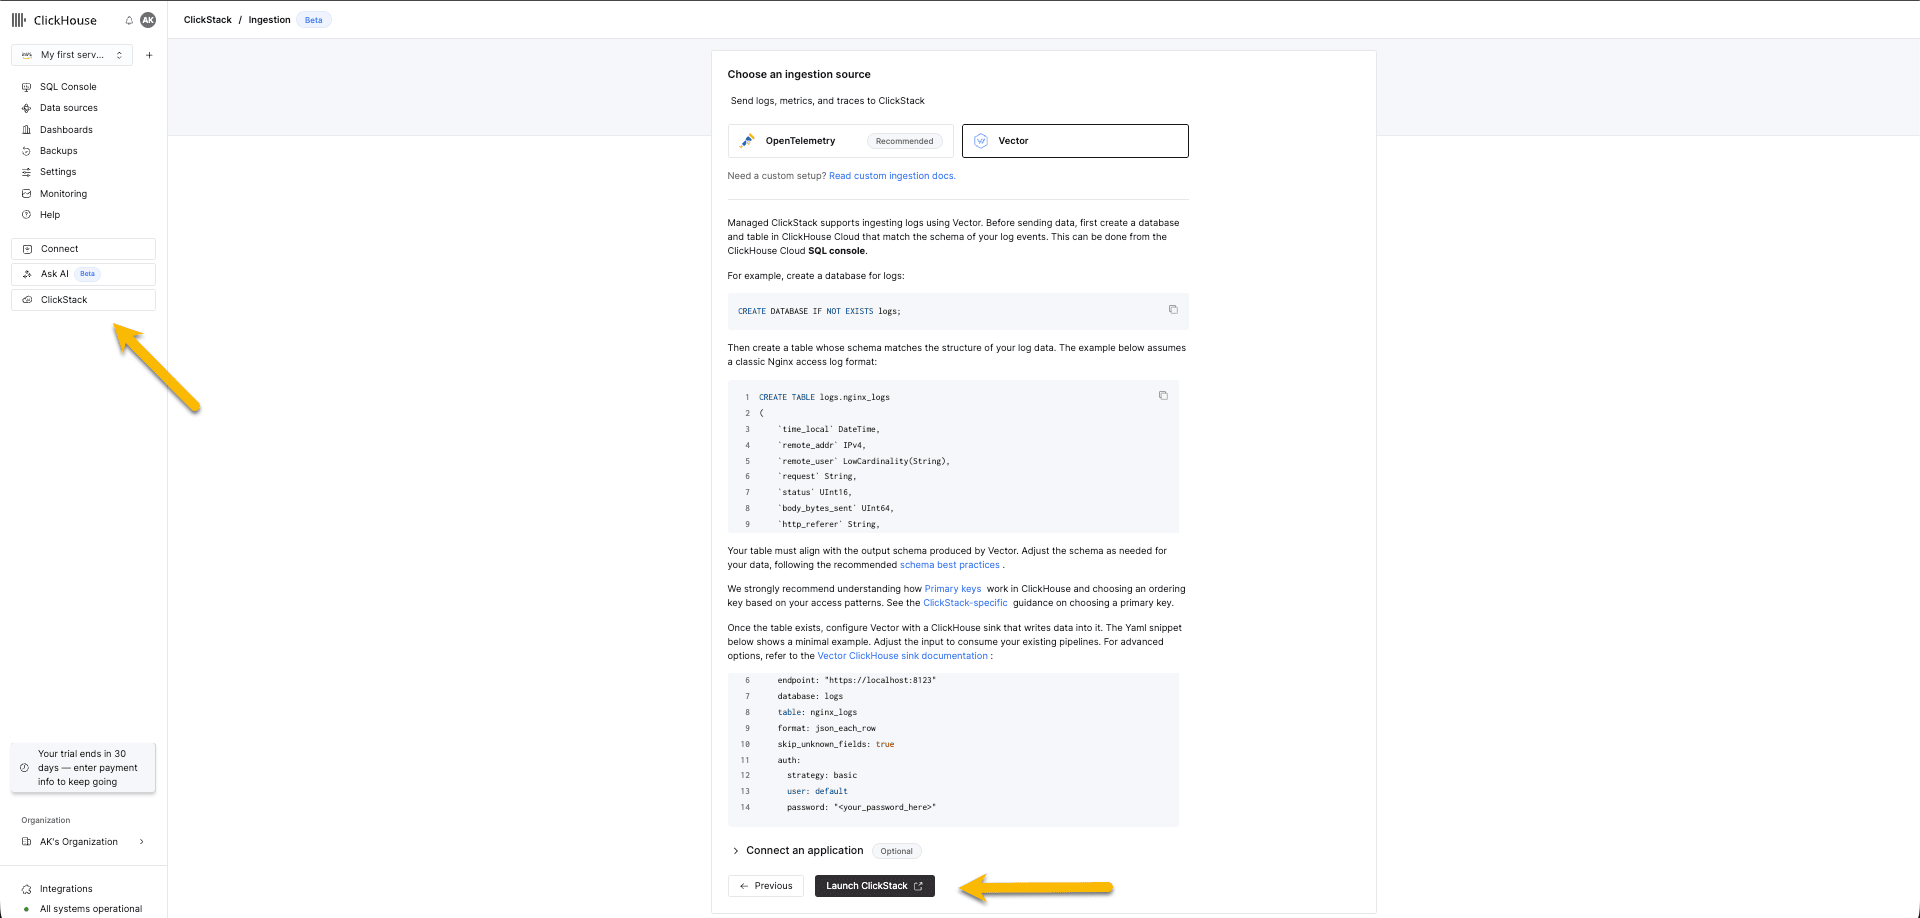
Navigate to your Managed ClickStack service and select “ClickStack” from the left-hand menu. If you’ve already completed the onboarding, this will launch the ClickStack UI in a new tab, and you will be automatically authenticated. If not, you can proceed through the onboarding and select “Launch ClickStack” once you’ve selected Vector as your input source.
Create a datasource
Create a logs data source. If no data sources exist, you will be prompted to create one on your first login. Otherwise, navigate to Team Settings and add a new data source.
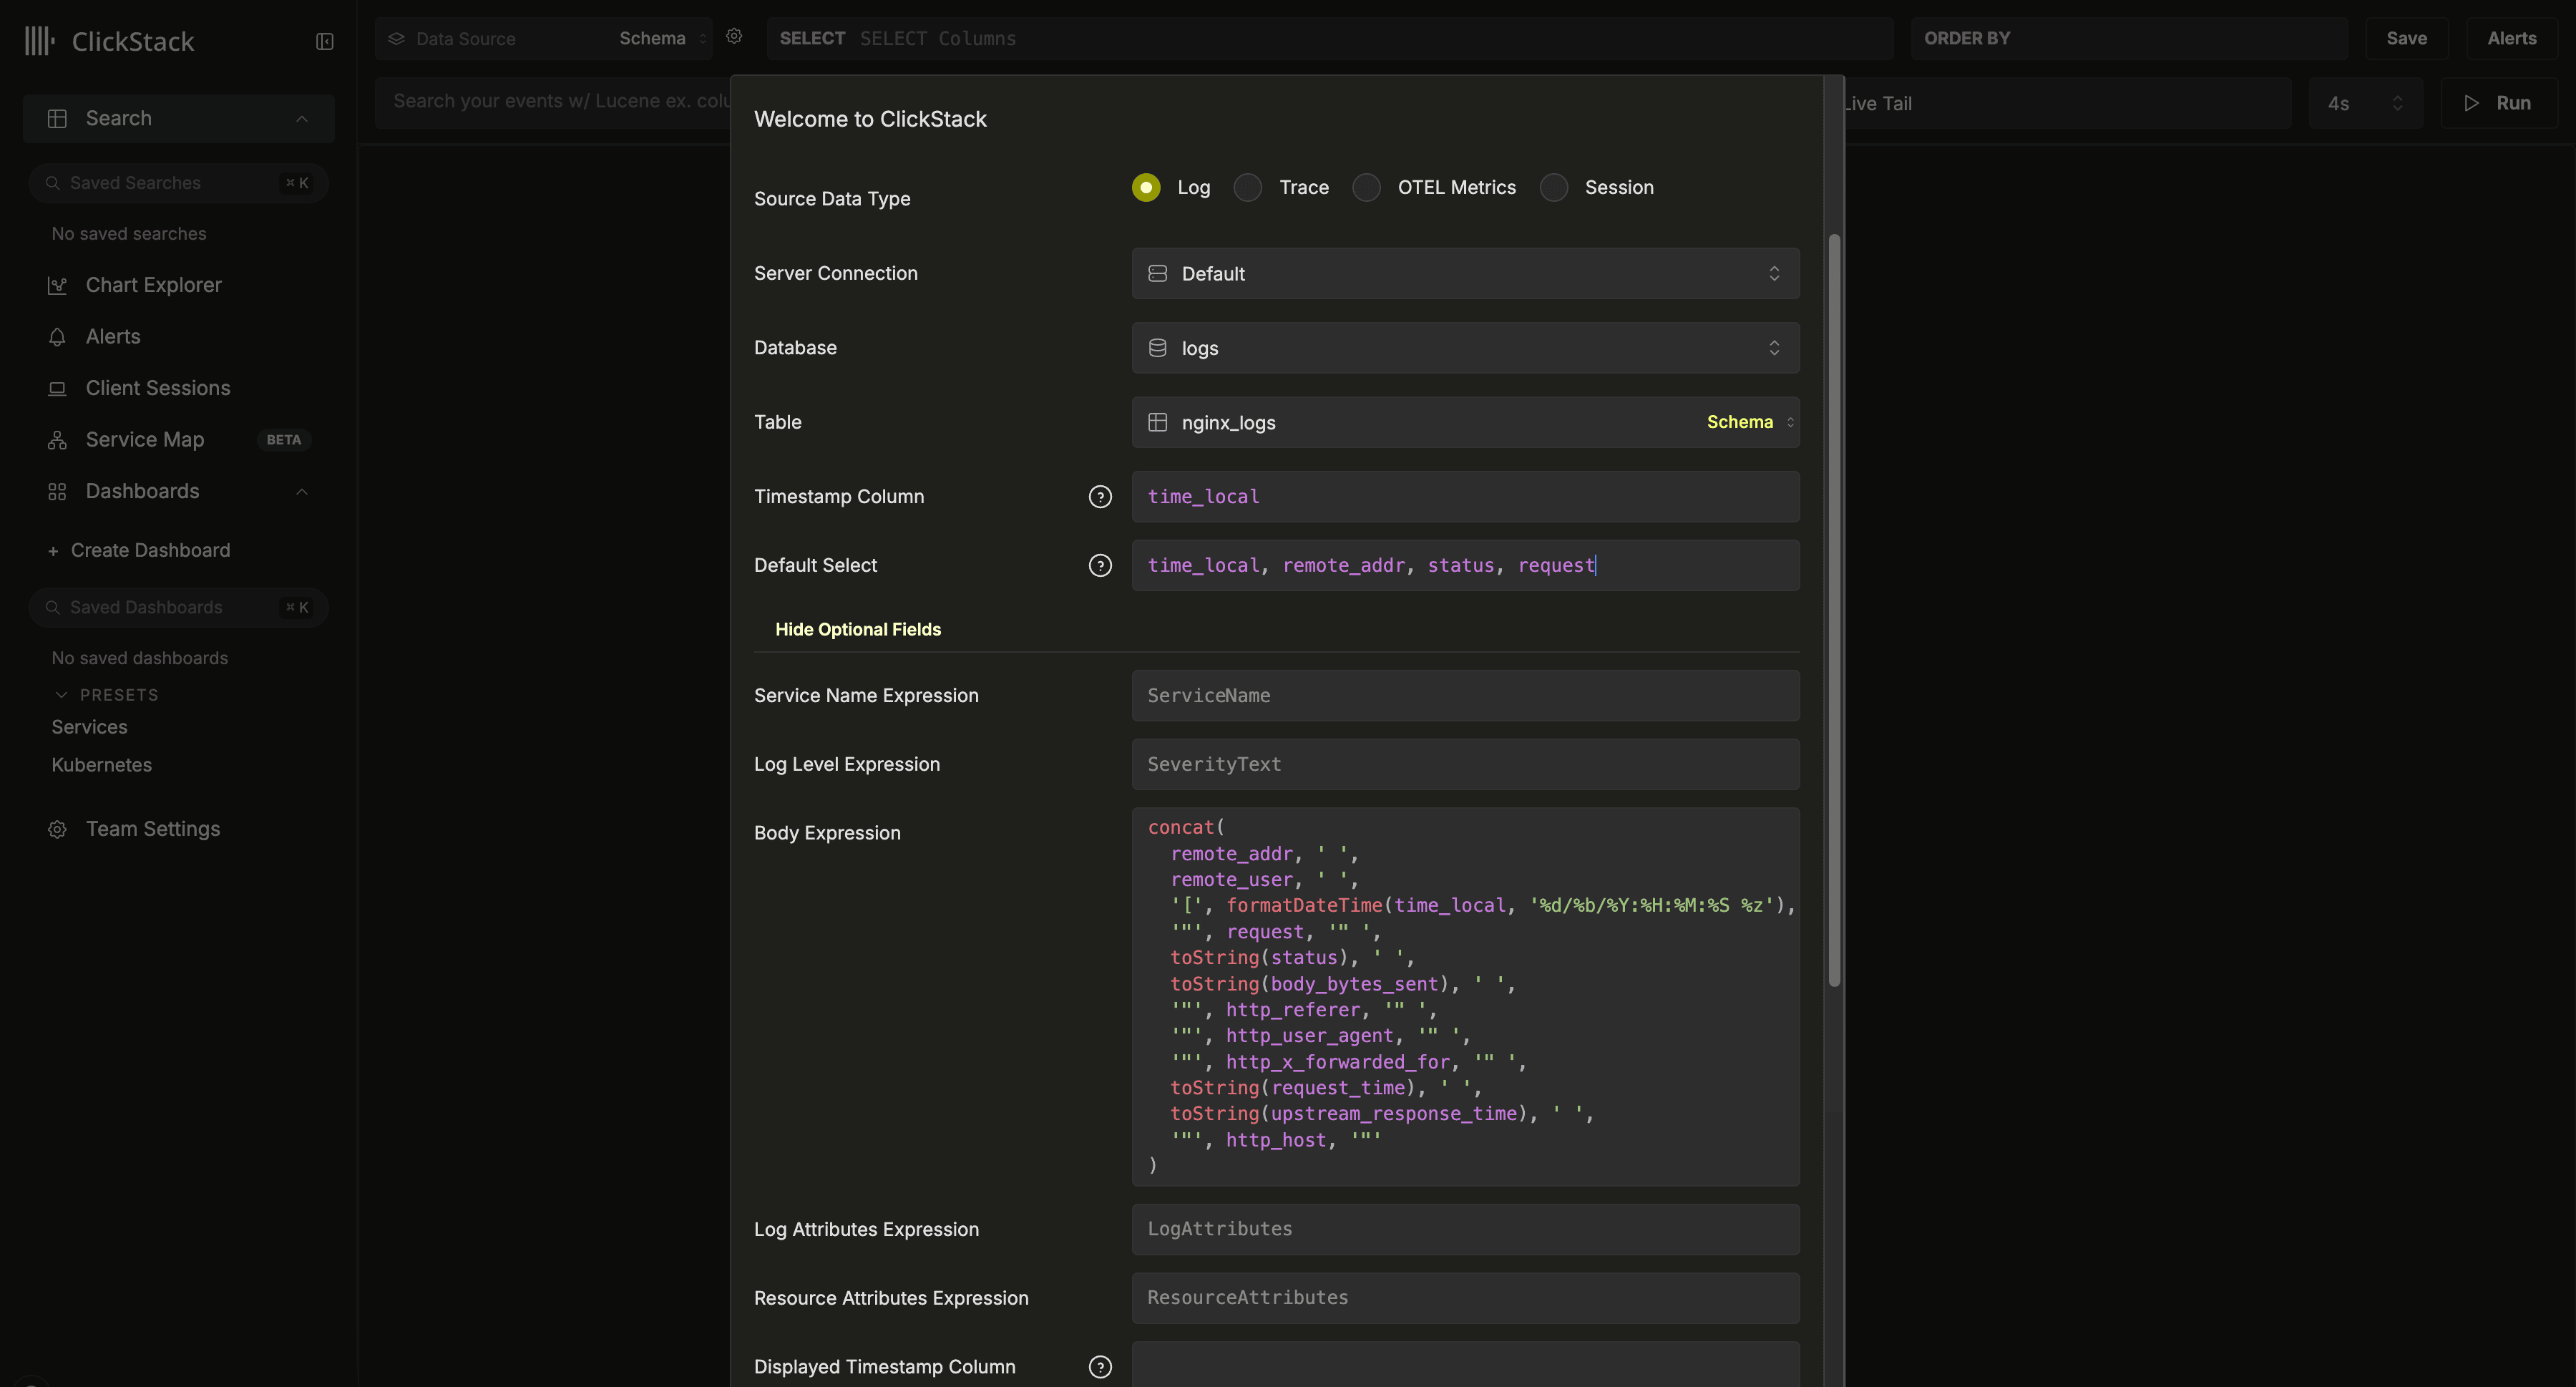
The configuration above assumes an Nginx-style schema with a time_local column used as the timestamp. This should be, where possible, the timestamp column declared in the primary key. This column is mandatory.
We also recommend updating the Default SELECT to explicitly define which columns are returned in the logs view. If additional fields are available, such as service name, log level, or a body column, these can also be configured. The timestamp display column can also be overridden if it differs from the column used in the table’s primary key and configured above.
In the example above, a Body column doesn’t exist in the data. Instead, it is defined using a SQL expression that reconstructs an Nginx log line from the available fields.
For other possible options, see the configuration reference.
Explore the data
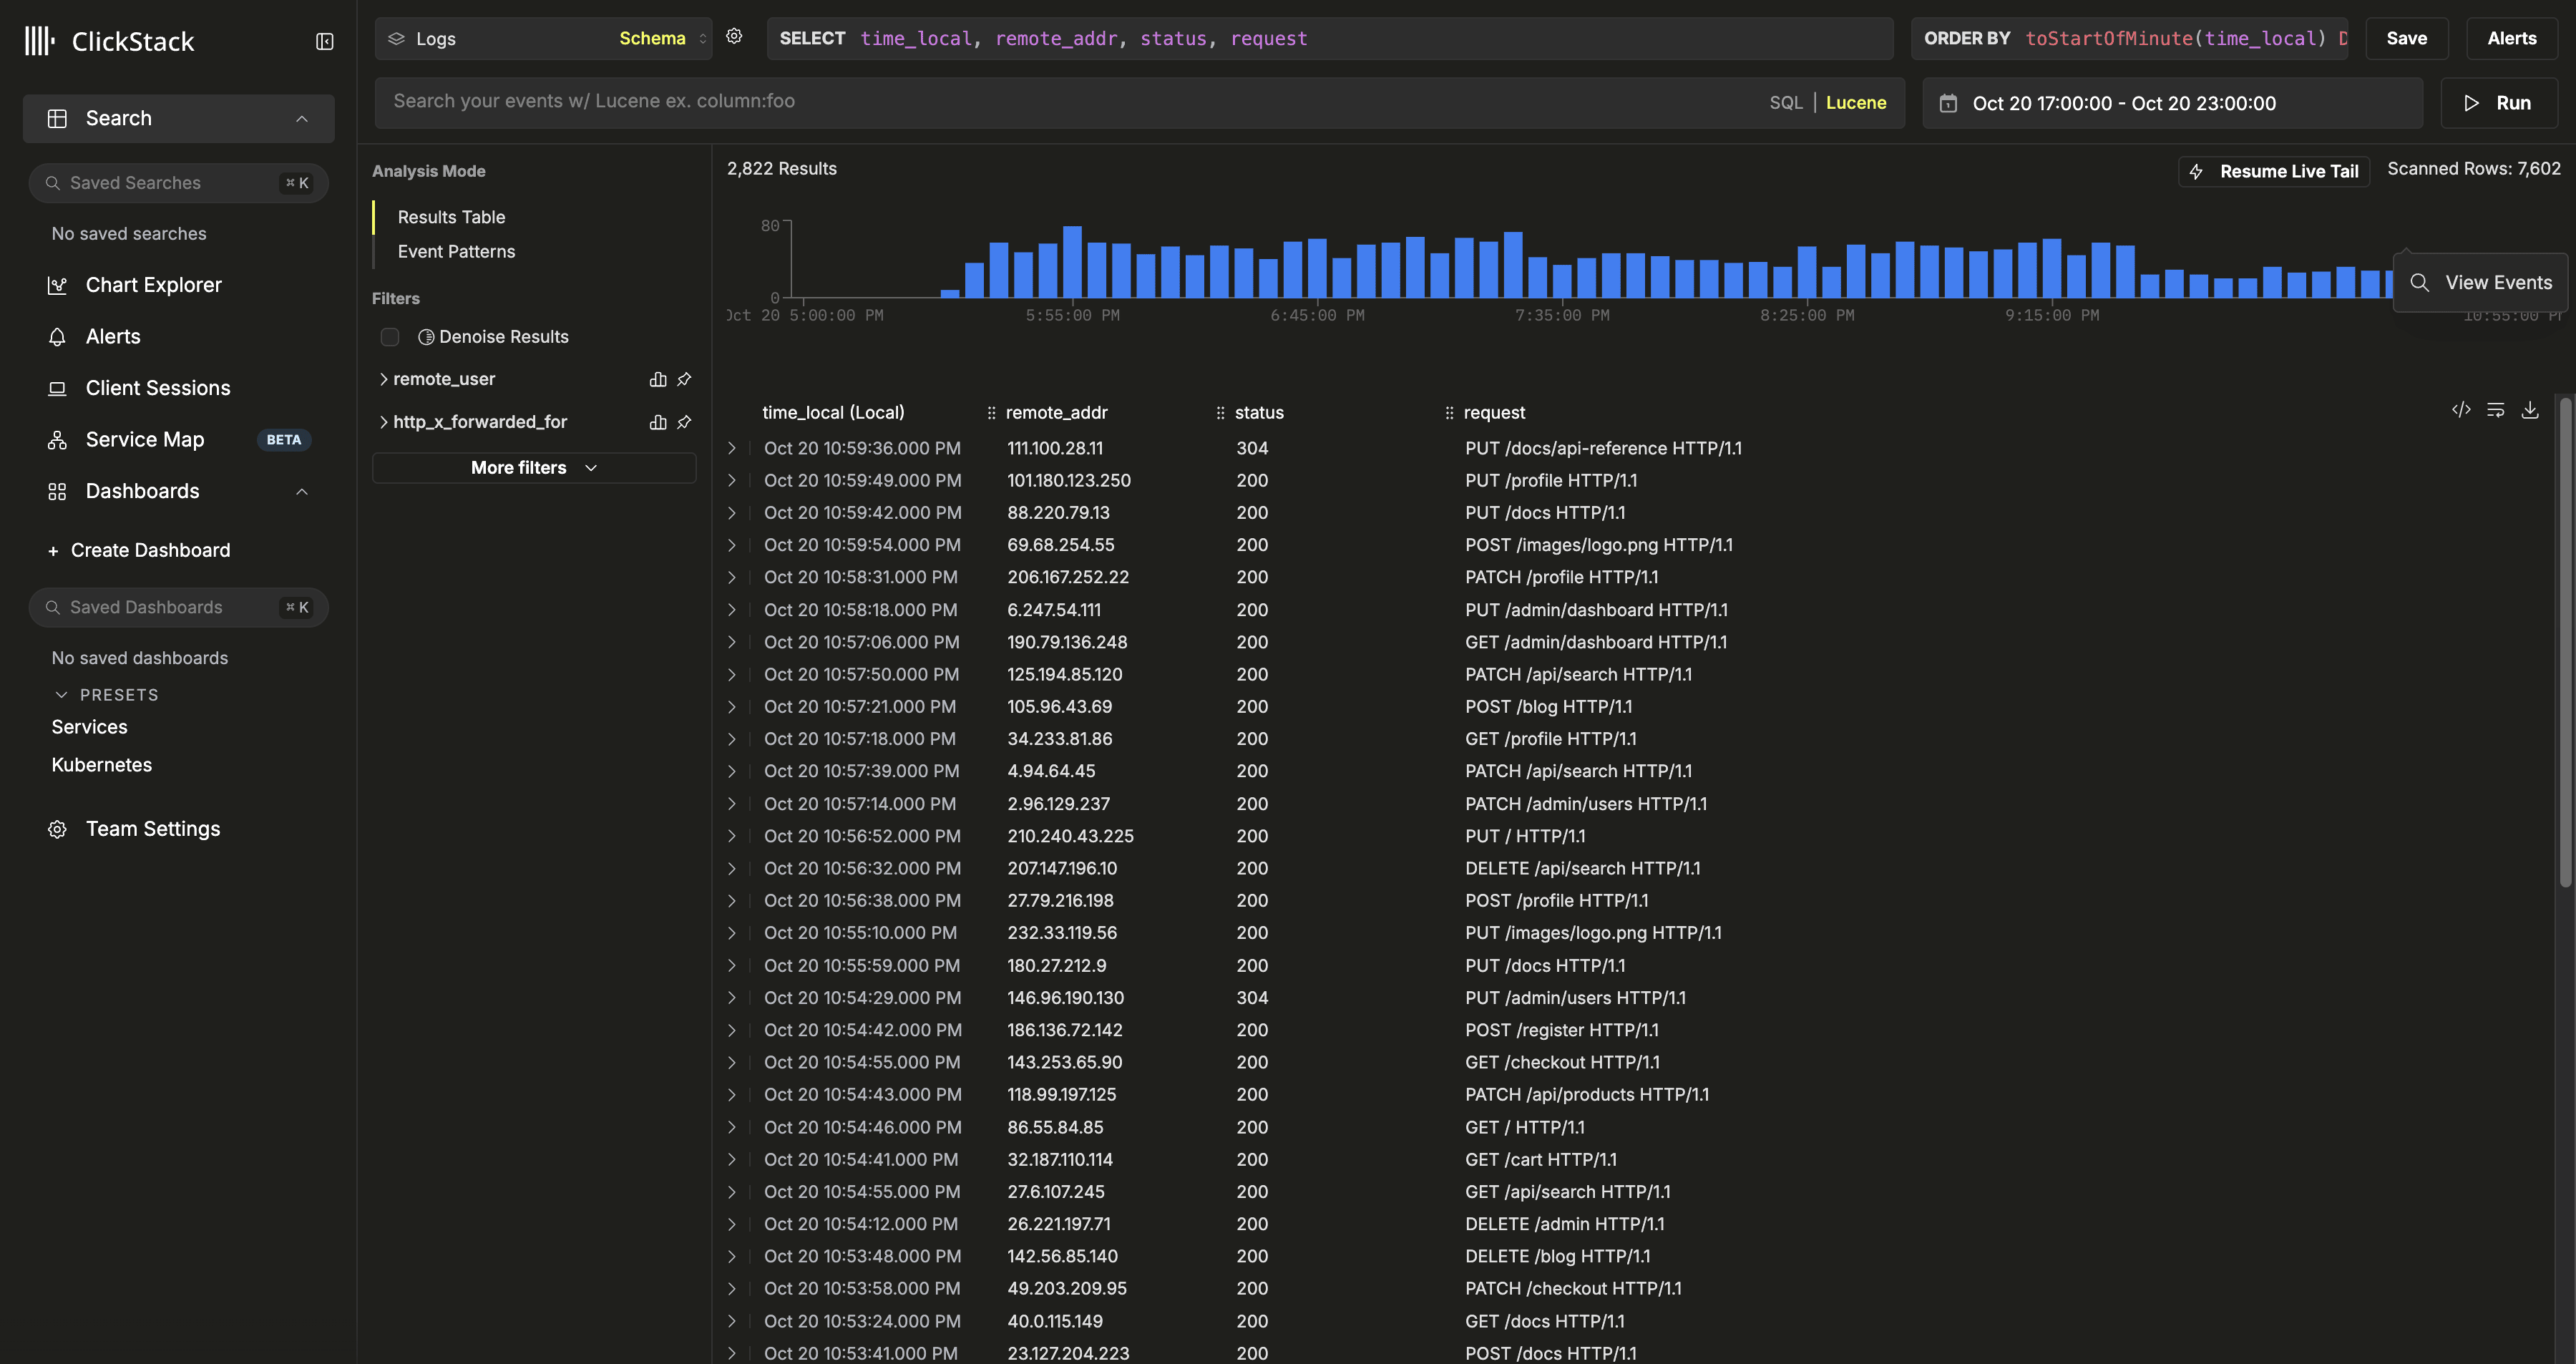
Navigate to the logs view to explore the data and begin using ClickStack.
Create a database and table
Vector requires a table and schema to be defined prior to data ingestion.
First create a database. This can be done via the ClickHouse Web user interface at http://localhost:8123/play. Use the default username and password api:api.
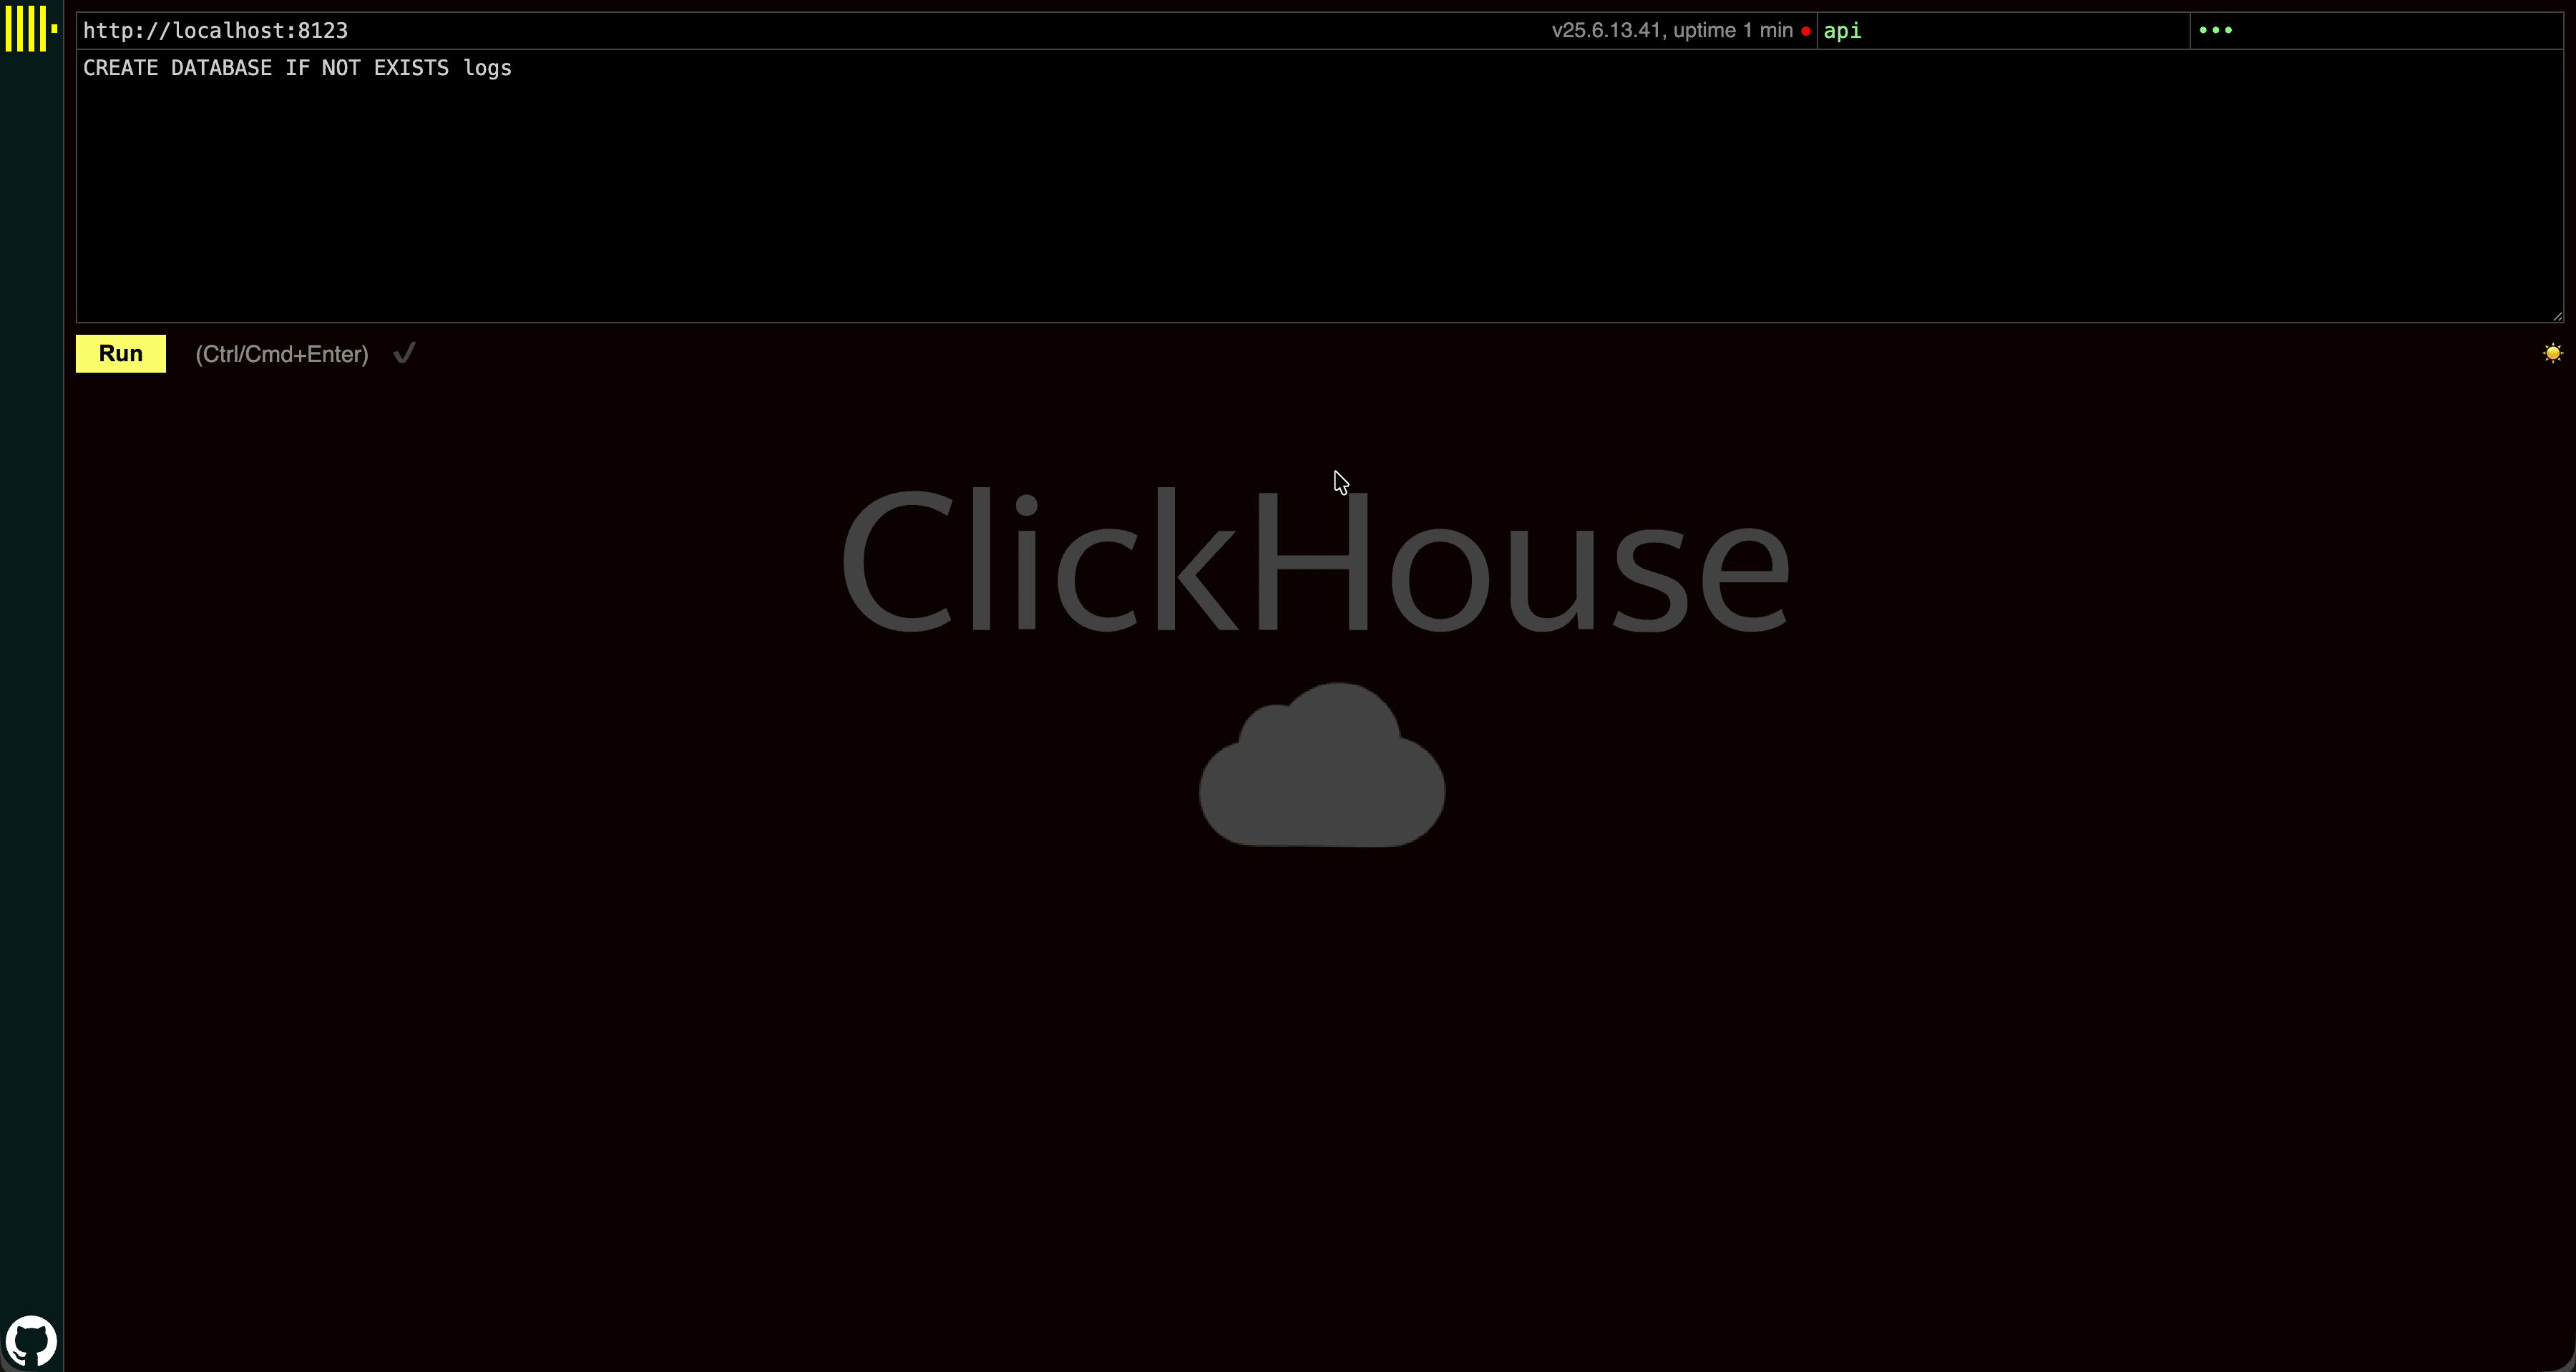
In the example below, we use logs:
CREATE DATABASE IF NOT EXISTS logsCreate a table for your data. This should match the output schema of your data. The example below assumes a classic Nginx structure. Adjust accordingly to your data, adhering to schema best practices. We strongly recommend familiarizing yourself with the concept of Primary keys, selecting your primary key based on the guidelines outlined here.
CREATE TABLE logs.nginx_logs
(
    `time_local` DateTime,
    `remote_addr` IPv4,
    `remote_user` LowCardinality(String),
    `request` String,
    `status` UInt16,
    `body_bytes_sent` UInt64,
    `http_referer` String,
    `http_user_agent` String,
    `http_x_forwarded_for` LowCardinality(String),
    `request_time` Float32,
    `upstream_response_time` Float32,
    `http_host` String
)
ENGINE = MergeTree
ORDER BY (toStartOfMinute(time_local), status, remote_addr)Add ClickHouse sink to vector configuration
Ingestion to ClickStack for Vector should occur directly to ClickHouse, bypassing the OTLP endpoint exposed by the collector.
Modify your Vector configuration to include the ClickHouse sink, updating the inputs field to receive events from your existing pipelines.
This configuration assumes that your upstream Vector pipeline has already prepared the data to match the target ClickHouse schema, meaning that fields are parsed, named correctly, and typed appropriately for insertion. See the Nginx example below for a complete illustration of parsing and normalizing raw log lines into a schema suitable for ClickStack.
sinks:
  clickhouse:
    type: clickhouse
    inputs:
      - your_input
    endpoint: "http://localhost:8123"
    database: logs
    format: json_each_row
    table: nginx_logs
    skip_unknown_fields: true
    auth:
      strategy: "basic"
      user: "api"
      password: "api"
By default, we recommend using the json_each_row format, which encodes each event as a single JSON object per row. This is the default and recommended format for ClickStack when ingesting JSON data, and should be preferred over alternative formats such as JSON objects encoded as strings.
The ClickHouse sink also supports Arrow stream encoding (currently in beta). This can offer higher throughput but comes with important constraints: the database and table must be static, as the schema is fetched once at startup, and dynamic routing isn’t supported. For this reason, Arrow encoding is best suited for fixed, well-defined ingestion pipelines.
We recommend reviewing the available sink configuration options in the Vector documentation:
Navigate to the ClickStack UI
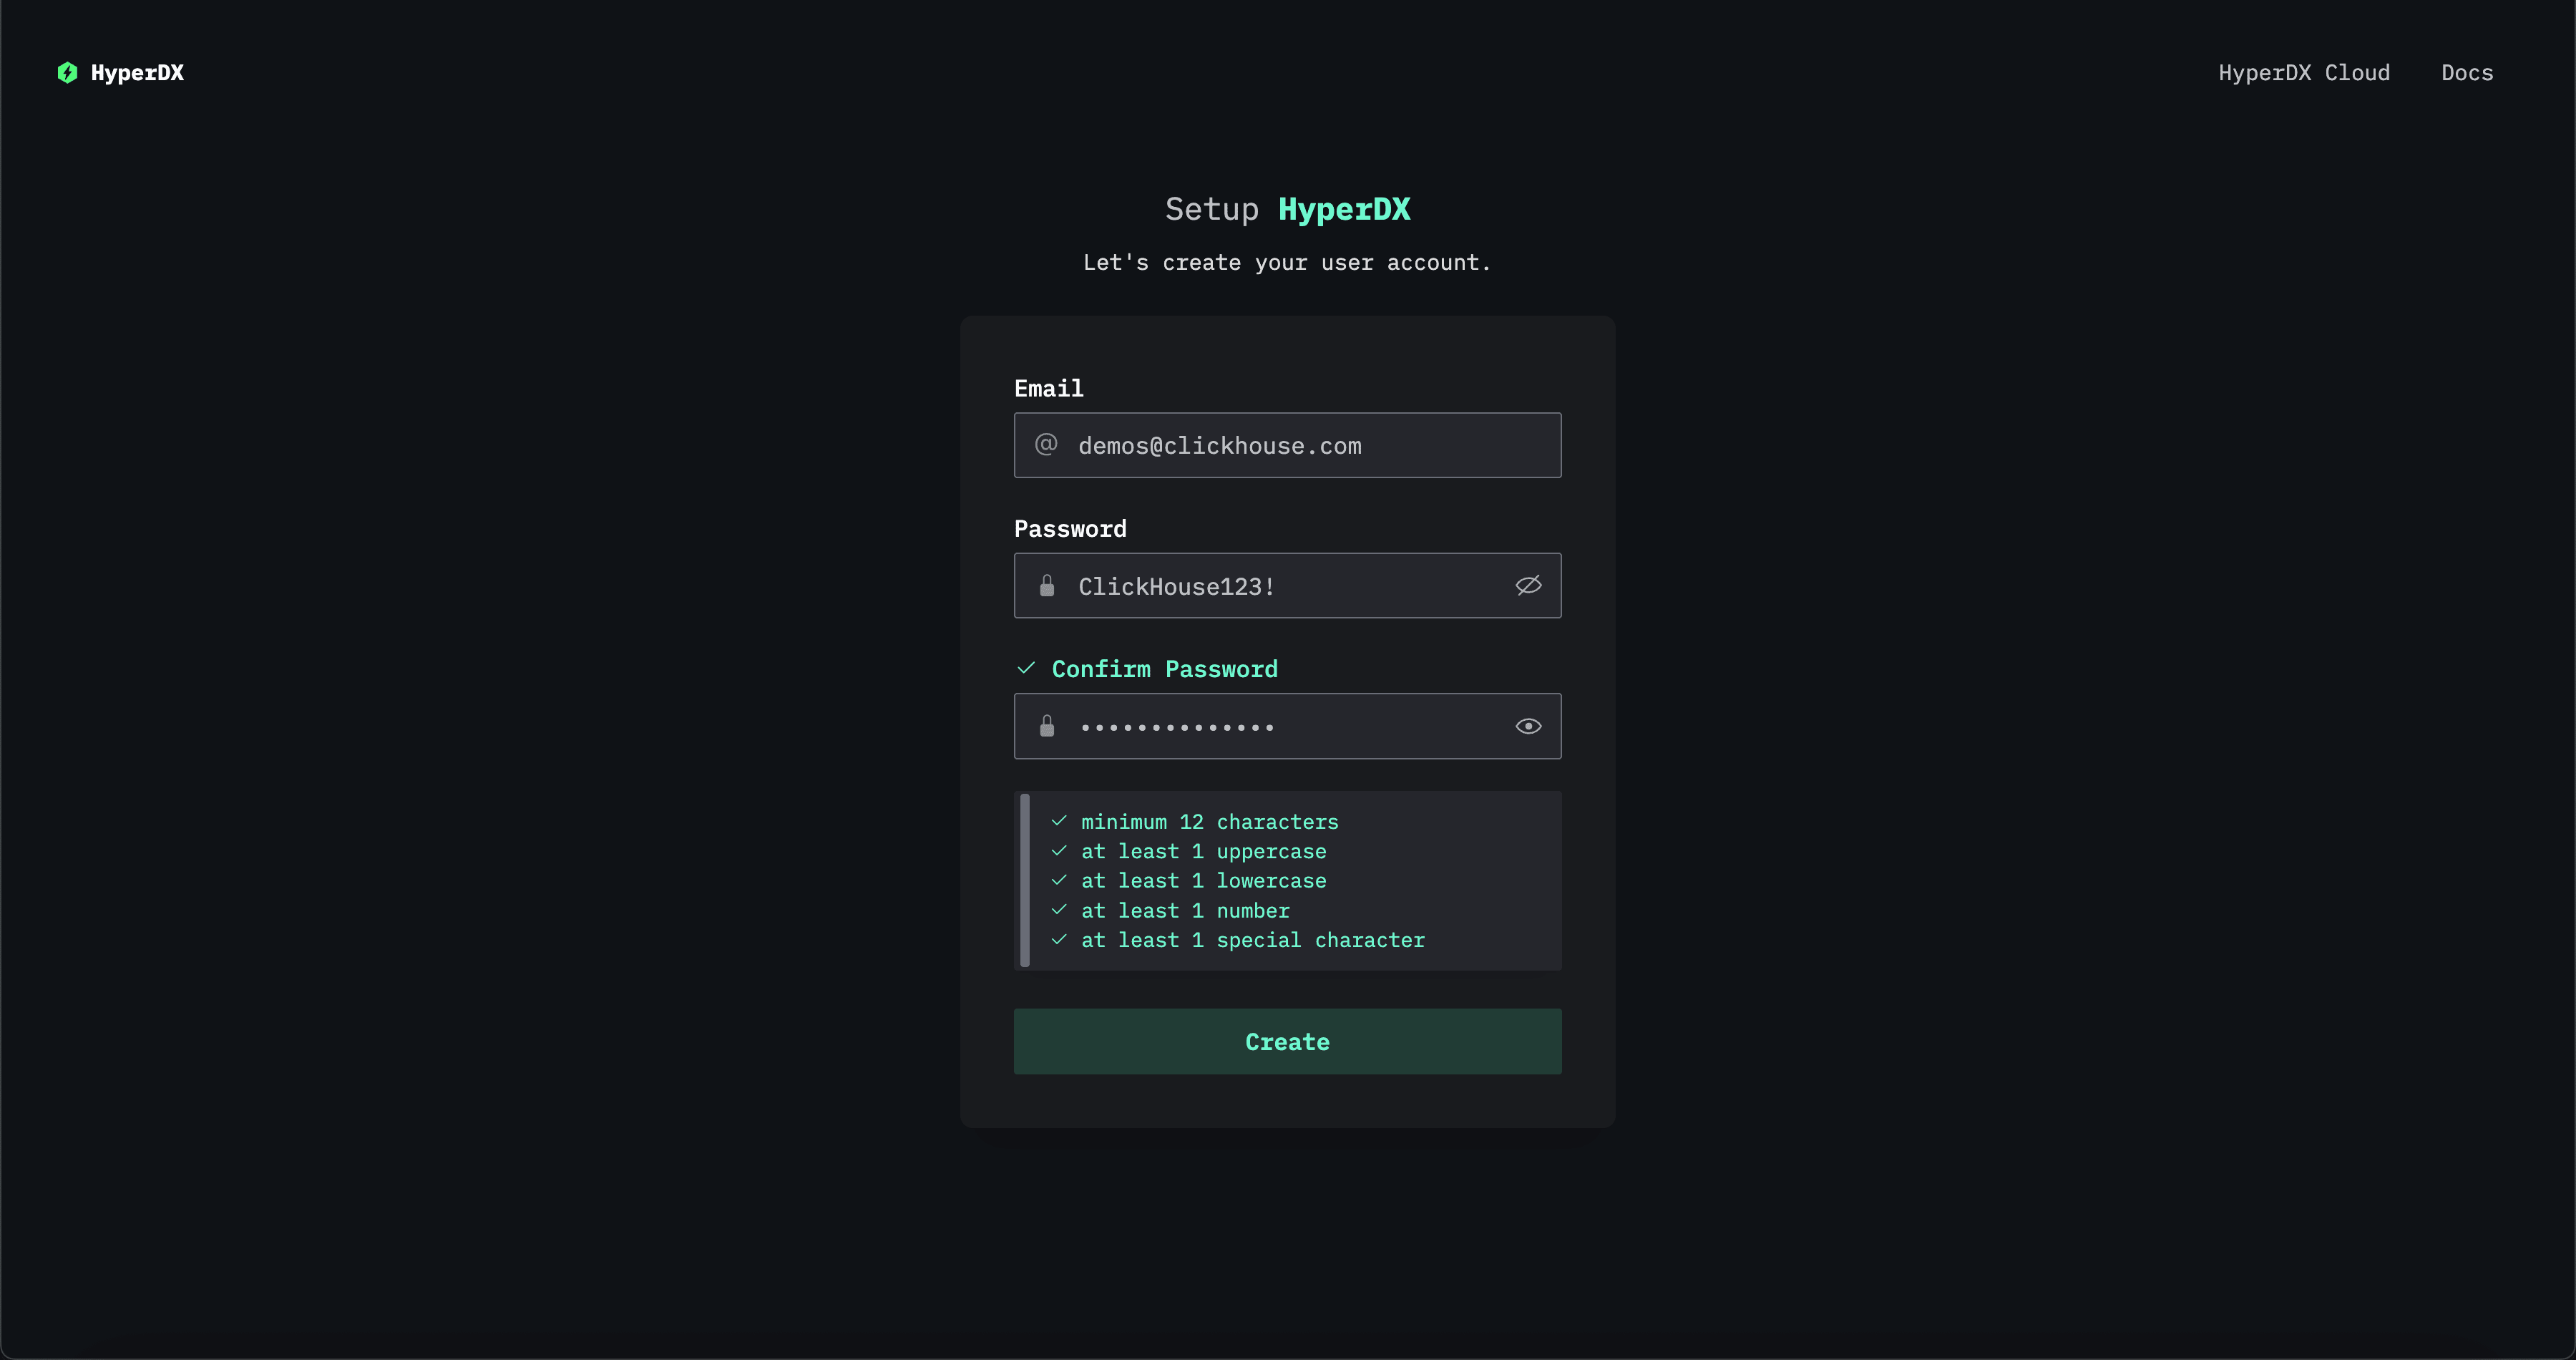
Navigate to the ClickStack UI at http://localhost:8080. Create a user if you haven’t completed the onboarding.
Create a datasource
Navigate to Team Settings and add a new data source.
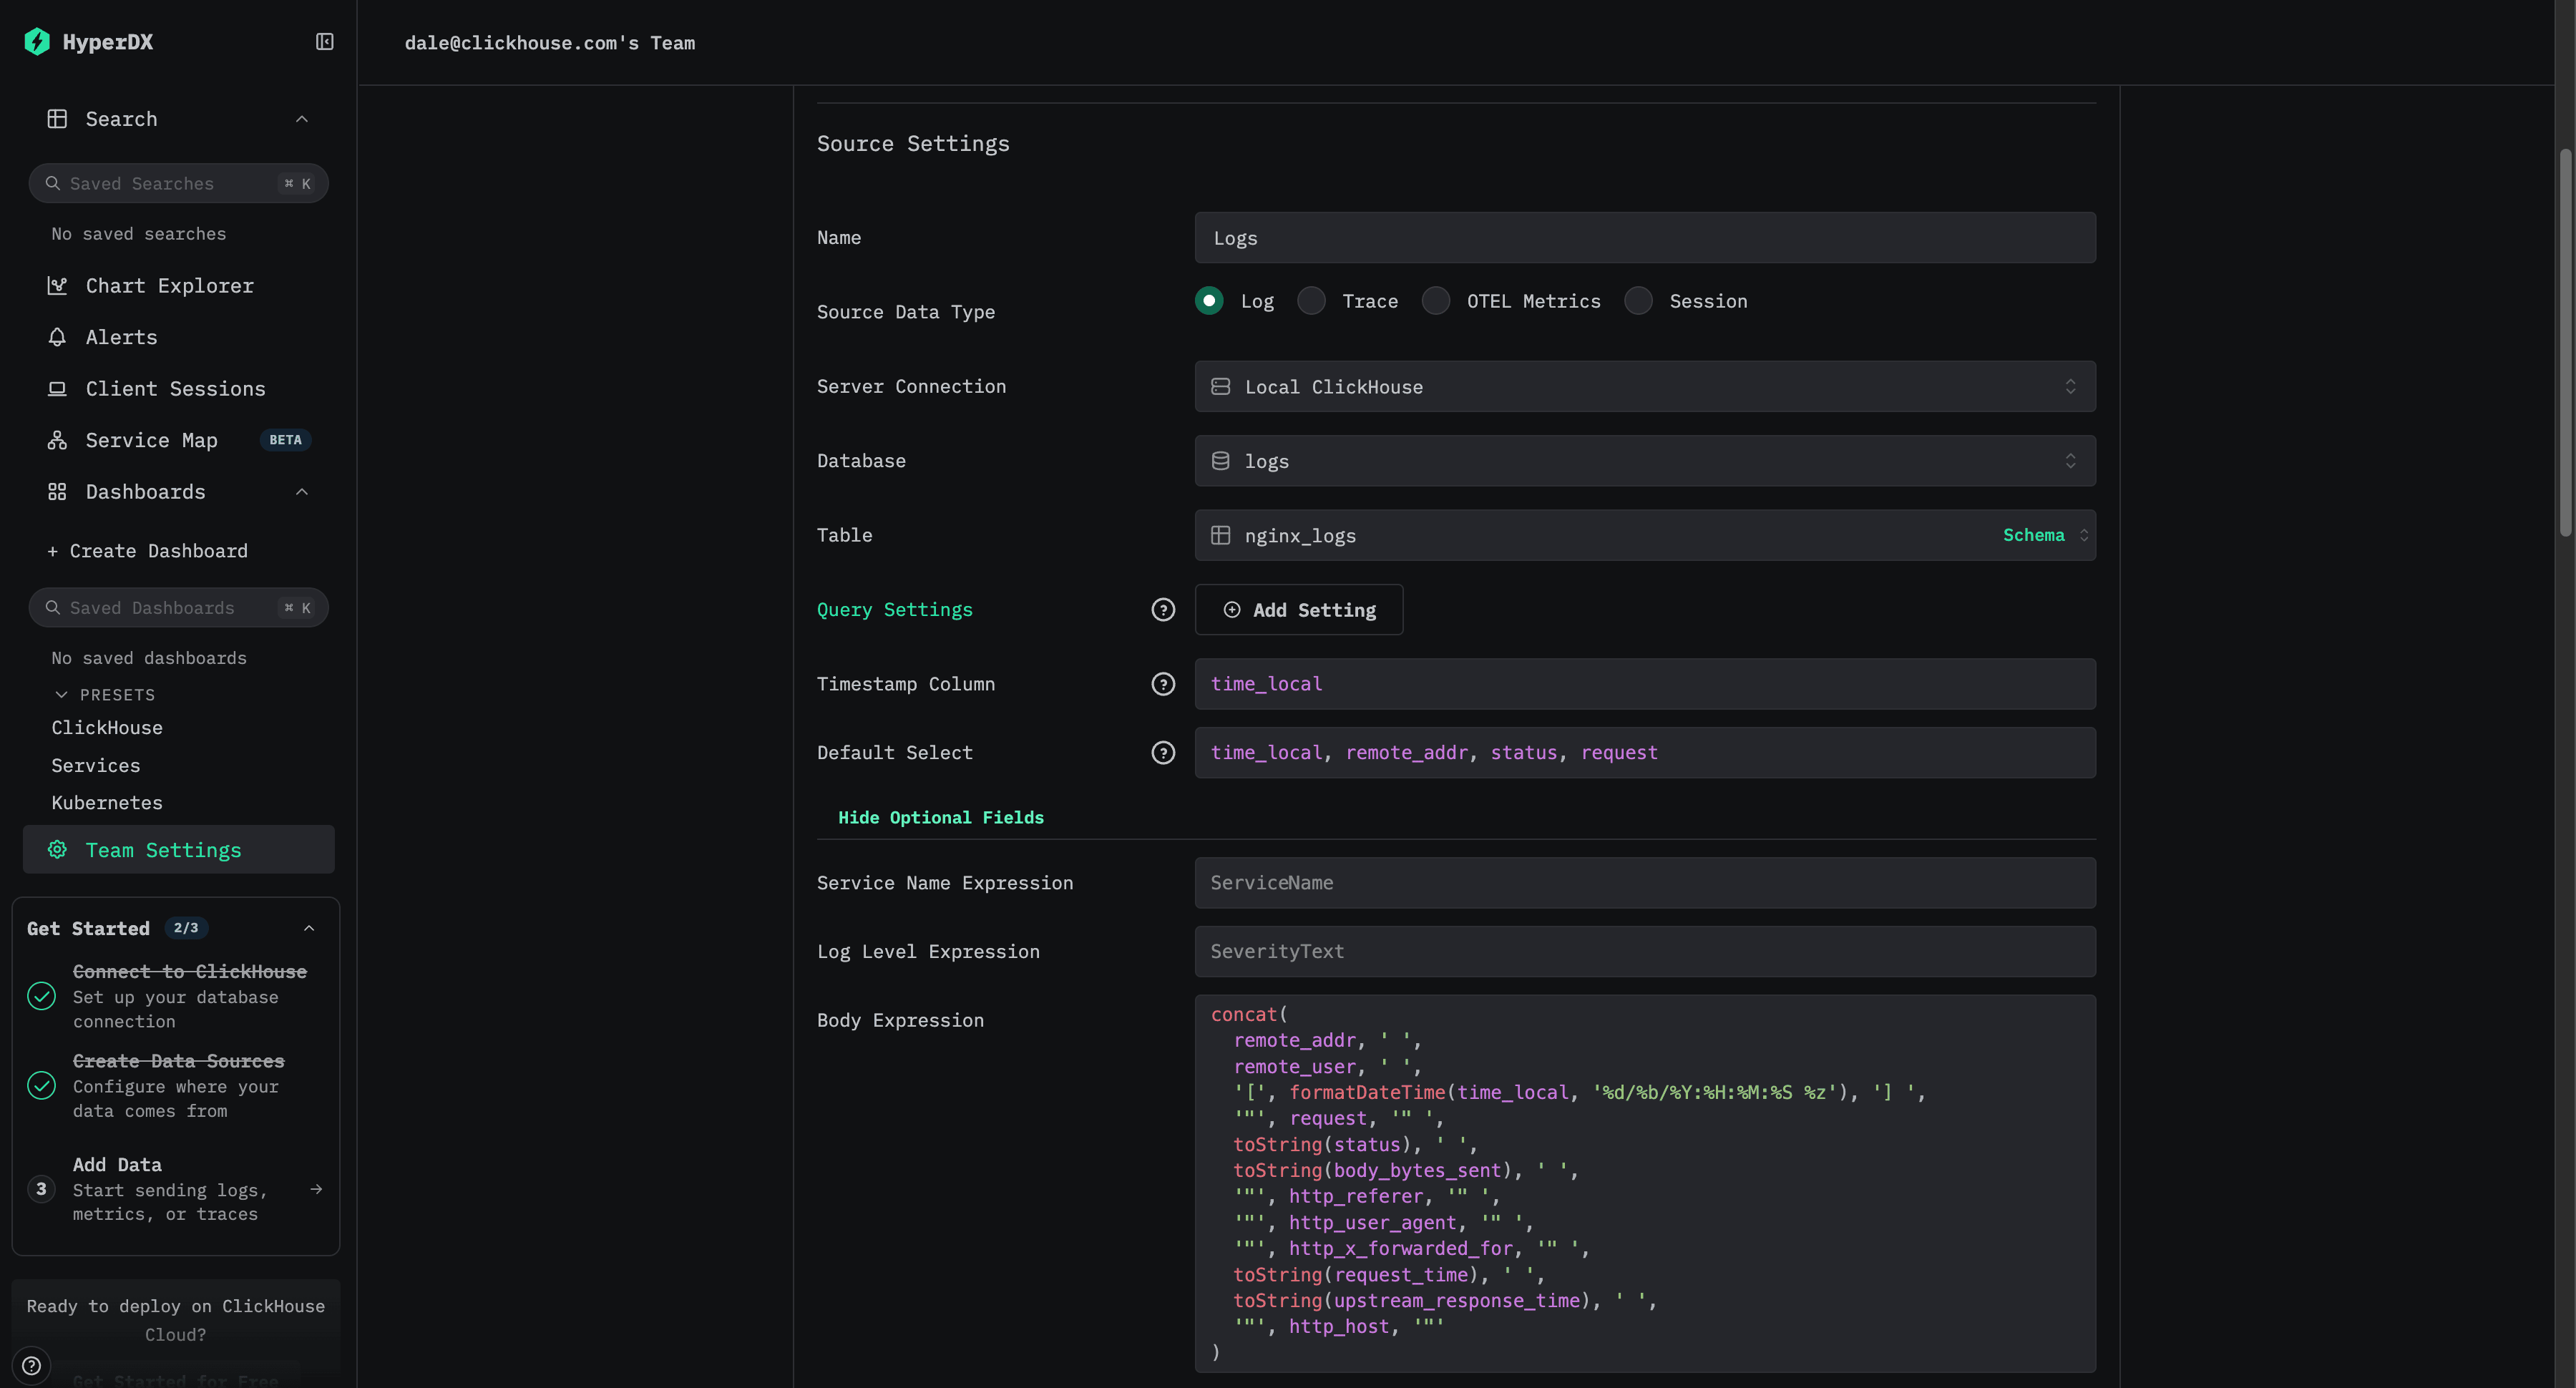
The configuration above assumes an Nginx-style schema with a time_local column used as the timestamp. This should be, where possible, the timestamp column declared in the primary key. This column is mandatory.
We also recommend updating the Default SELECT to explicitly define which columns are returned in the logs view. If additional fields are available, such as service name, log level, or a body column, these can also be configured. The timestamp display column can also be overridden if it differs from the column used in the table’s primary key and configured above.
In the example above, a Body column doesn’t exist in the data. Instead, it is defined using a SQL expression that reconstructs an Nginx log line from the available fields.
For other possible options, see the configuration reference.
Explore the data
Navigate to the logs view to explore the data and begin using ClickStack.
Example dataset with Vector
For a more complete example, we use an Nginx log file below.
The following guide assumes you have already created a Managed ClickStack service and recorded your service credentials. If you haven’t, follow the Getting Started guide for Managed ClickStack until promoted to configure Vector.
Installing Vector
Before proceeding, ensure that Vector is installed on the system where you plan to run your ingestion pipeline. Follow the official Vector installation guide to install a prebuilt binary or package appropriate for your environment:
Once installed, verify that the vector binary is available on your path before continuing with the configuration steps below.
This can be installed on the same instance as your ClickStack OTel collector.
Follow best practices for architecture and security when moving Vector to production.
Download the sample data
If you wish to experiment with a sample dataset, download the following example nginx sample.
curl -O https://datasets-documentation.s3.eu-west-3.amazonaws.com/clickstack-integrations/access.logCreate a database and table
Vector requires a table and schema to be defined prior to data ingestion.
First create a database. This can be done via the ClickHouse Cloud console.
Create a database logs:
CREATE DATABASE IF NOT EXISTS logsCreate a table for your data.
CREATE TABLE logs.nginx_logs
(
    `time_local` DateTime,
    `remote_addr` IPv4,
    `remote_user` LowCardinality(String),
    `request` String,
    `status` UInt16,
    `body_bytes_sent` UInt64,
    `http_referer` String,
    `http_user_agent` String,
    `http_x_forwarded_for` LowCardinality(String),
    `request_time` Float32,
    `upstream_response_time` Float32,
    `http_host` String
)
ENGINE = MergeTree
ORDER BY (toStartOfMinute(time_local), status, remote_addr)Copy Vector configuration
Copy the vector configuration and create a file nginx.yaml, setting the CLICKHOUSE_ENDPOINT and CLICKHOUSE_PASSWORD.
data_dir: ./.vector-data
sources:
  nginx_logs:
    type: file
    include:
      - access.log
    read_from: beginning

transforms:
  decode_json:
    type: remap
    inputs:
      - nginx_logs
    source: |
      . = parse_json!(to_string!(.message))
      ts = parse_timestamp!(.time_local, format: "%d/%b/%Y:%H:%M:%S %z")
      # ClickHouse-friendly DateTime format
      .time_local = format_timestamp!(ts, format: "%F %T")

sinks:
  clickhouse:
    type: clickhouse
    inputs:
      - decode_json
    endpoint: "<CLICKHOUSE_ENDPOINT>"
    database: logs
    format: json_each_row
    table: nginx_logs
    skip_unknown_fields: true
    auth:
      strategy: "basic"
      user: "default"
password: "<CLICKHOUSE_PASSWORD>"Start Vector
Start Vector with the following command, creating the data directory first to record file offsets.
mkdir ./.vector-data
vector --config nginx.yaml
Navigate to the ClickStack UI
Navigate to your Managed ClickStack service and select “ClickStack” from the left-hand menu. If you’ve already completed the onboarding, this will launch the ClickStack UI in a new tab, and you will be automatically authenticated. If not, you can proceed through the onboarding and select “Launch ClickStack” once you’ve selected Vector as your input source.
Create a datasource
Create a logs data source. If no data sources exist, you will be prompted to create one on first login. Otherwise, navigate to Team Settings and add a new data source.
The configuration assumes the Nginx schema with a time_local column used as the timestamp. This is the timestamp column declared in the primary key. This column is mandatory.
We have also specified the default select to be time_local, remote_addr, status, request, which defines which columns are returned in the logs view.
In the example above, a Body column doesn’t exist in the data. Instead, it is defined as the SQL expression:
concat(
  remote_addr, ' ',
  remote_user, ' ',
  '[', formatDateTime(time_local, '%d/%b/%Y:%H:%M:%S %z'), '] ',
  '"', request, '" ',
  toString(status), ' ',
  toString(body_bytes_sent), ' ',
  '"', http_referer, '" ',
  '"', http_user_agent, '" ',
  '"', http_x_forwarded_for, '" ',
  toString(request_time), ' ',
  toString(upstream_response_time), ' ',
  '"', http_host, '"'
)
This reconstructs the log line from the structured fields.
For other possible options, see the configuration reference.
Explore the data
Navigate to the search view for October 20th, 2025 to explore the data and begin using ClickStack.
The following guide assumes you have set up ClickStack Open Source with the Getting Started guide.
Installing vector
Before proceeding, ensure that Vector is installed on the system where you plan to run your ingestion pipeline. Follow the official Vector installation guide to install a prebuilt binary or package appropriate for your environment:
Once installed, verify that the vector binary is available on your path before continuing with the configuration steps below.
This can be installed on the same instance as your ClickStack OTel collector.
Follow best practices for architecture and security when moving Vector to production.
Download the sample data
If you wish to experiment with a sample dataset, download the following example nginx sample.
curl -O https://datasets-documentation.s3.eu-west-3.amazonaws.com/clickstack-integrations/access.logCreate a database and table
Vector requires a table and schema to be defined prior to data ingestion.
First create a database. This can be done via the ClickHouse Web user interface at http://localhost:8123/play. Use the default username and password api:api.
Create a database logs:
CREATE DATABASE IF NOT EXISTS logsCreate a table for your data.
CREATE TABLE logs.nginx_logs
(
    `time_local` DateTime,
    `remote_addr` IPv4,
    `remote_user` LowCardinality(String),
    `request` String,
    `status` UInt16,
    `body_bytes_sent` UInt64,
    `http_referer` String,
    `http_user_agent` String,
    `http_x_forwarded_for` LowCardinality(String),
    `request_time` Float32,
    `upstream_response_time` Float32,
    `http_host` String
)
ENGINE = MergeTree
ORDER BY (toStartOfMinute(time_local), status, remote_addr)Copy Vector configuration
Ingestion to ClickStack for Vector should occur directly to ClickHouse, bypassing the OTLP endpoint exposed by the collector.
Copy the vector configuration and create a file nginx.yaml.
data_dir: ./.vector-data
sources:
  nginx_logs:
    type: file
    include:
      - access.log
    read_from: beginning

transforms:
  decode_json:
    type: remap
    inputs:
      - nginx_logs
    source: |
      . = parse_json!(to_string!(.message))
      ts = parse_timestamp!(.time_local, format: "%d/%b/%Y:%H:%M:%S %z")
      # ClickHouse-friendly DateTime format
      .time_local = format_timestamp!(ts, format: "%F %T")

sinks:
  clickhouse:
    type: clickhouse
    inputs:
      - decode_json
    endpoint: "http://localhost:8123"
    database: logs
    format: json_each_row
    table: nginx_logs
    skip_unknown_fields: true
    auth:
      strategy: "basic"
      user: "api"
password: "api"Start Vector
Start Vector with the following command.
mkdir ./.vector-data
vector --config nginx-local.yaml
Create a datasource
Create a logs data source via Team -> Sources
The configuration assumes the Nginx schema with a time_local column used as the timestamp. This is the timestamp column declared in the primary key. This column is mandatory.
We have also specified the default select to be time_local, remote_addr, status, request, which defines which columns are returned in the logs view.
In the example above, a Body column doesn’t exist in the data. Instead, it is defined as the SQL expression:
concat(
  remote_addr, ' ',
  remote_user, ' ',
  '[', formatDateTime(time_local, '%d/%b/%Y:%H:%M:%S %z'), '] ',
  '"', request, '" ',
  toString(status), ' ',
  toString(body_bytes_sent), ' ',
  '"', http_referer, '" ',
  '"', http_user_agent, '" ',
  '"', http_x_forwarded_for, '" ',
  toString(request_time), ' ',
  toString(upstream_response_time), ' ',
  '"', http_host, '"'
)
This reconstructs the log line from the structured fields.
For other possible options, see the configuration reference.
Navigate to the ClickStack UI
Navigate to the ClickStack UI at http://localhost:8080. Create a user if you haven’t completed the onboarding.
Explore the data
Navigate to the search view for October 20th, 2025 to explore the data and begin using ClickStack.