

 Set up docs MCP
What is Bindplane?
Bindplane is an OpenTelemetry-native telemetry pipeline that provides centralized management for OpenTelemetry Collectors. It simplifies operating large collector fleets by offering visual configuration editing, safe rollouts, and pipeline intelligence.
Why Bindplane + ClickStack?
At scale, managing fleets of OpenTelemetry Collectors becomes the operational bottleneck. ClickStack has proven it can handle extreme ingestion volumes—customers are ingesting telemetry at gigabytes per second and storing hundreds of petabytes. The challenge shifts from query performance to reliably operating the collector infrastructure feeding ClickHouse.
Bindplane solves this by providing:
- Centralized management for OpenTelemetry Collectors from thousands to over a million
- Visual configuration editing with safe, one-click rollouts
- Automatic resource detection and enrichment applied consistently before data reaches ClickStack
- Fan-out routing, so the same telemetry streams can be sent to ClickStack and other destinations simultaneously
- Full pipeline visibility, including collector health, throughput, and end-to-end performance
Prerequisites
- ClickStack instance running (local, Server, or ClickHouse Cloud)
- Bindplane account (create an account at
app.bindplane.com) - Installed Bindplane OTel Collector (see Install Your First Collector)
- Network connectivity from Bindplane collectors to your ClickStack OTLP endpoint
- ClickStack API Ingestion Key (found in ClickStack Team Settings > API Keys, view docs here for reference)
- Appropriate network ports open (
4318for HTTP/s or4317for gRPC)
Integrate ClickStack with Bindplane
Configure ClickStack as a destination
- Log in to your Bindplane account
- Navigate to Library
- Click Add Destination
- Select ClickStack from the list of available destinations
- Configure the connection:
- Protocol: Choose HTTP or gRPC (default: HTTP on port
4318) - Hostname: Enter your ClickStack OTLP endpoint hostname or IP address
- Port: Enter the port (
4318for HTTP,4317for gRPC) - API Ingestion Key: Enter your ClickStack API Ingestion Key
- Protocol: Choose HTTP or gRPC (default: HTTP on port
- Give the destination a name (e.g., “ClickStack Production”)
- Click Save to create the destination
Create a configuration
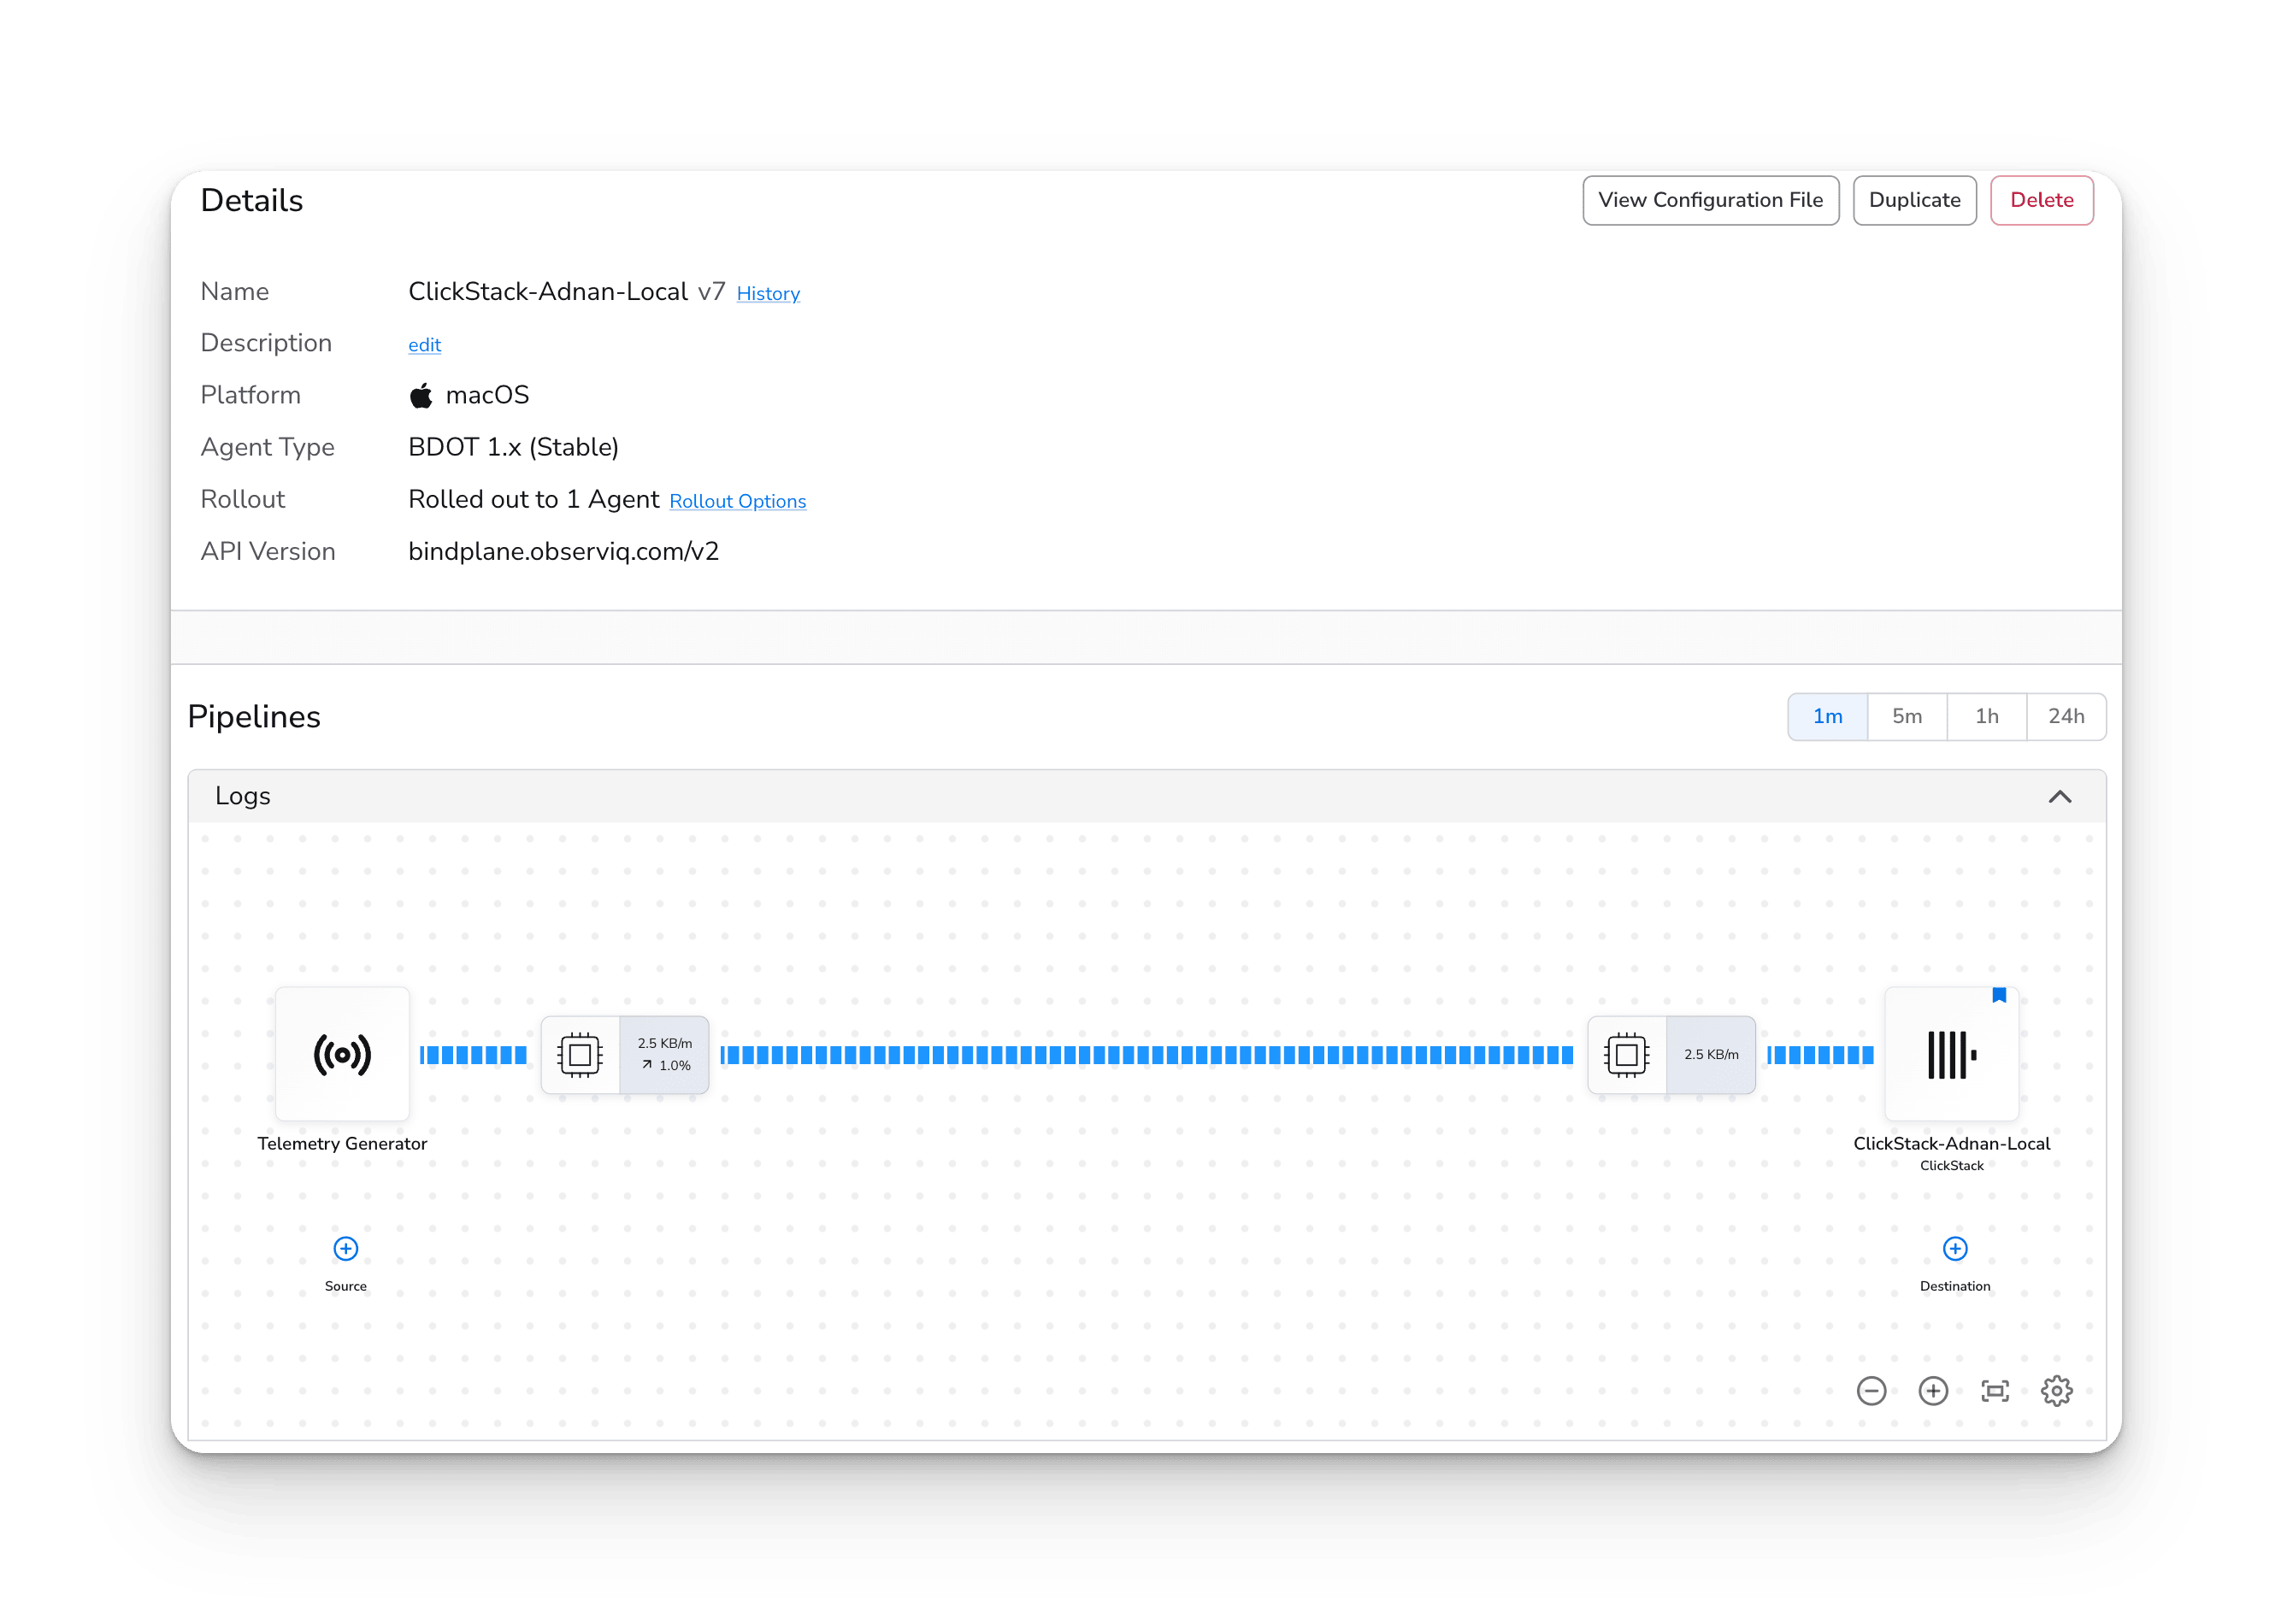
Once your ClickStack destination is configured, create a configuration to process and route telemetry:
- Navigate to Configurations → Create Configuration
- Give the configuration a name (e.g., “ClickStack Pipeline”)
- Select the Collector Type and Platform for your deployment
- Add sources:
- Click Add Source to select from 80+ available sources
- For testing, you can add a telemetry generator source to simulate traffic
- For production, add sources for your actual telemetry (logs, metrics, traces)
- Add the ClickStack destination:
- Click Add Destination
- Select the ClickStack destination you created in the previous step
- Choose which telemetry types to send (Logs, Metrics, Traces, or all)
Add processors (optional)
Bindplane provides pipeline intelligence and processor recommendations. You can add processors to:
- Filter: Reduce data volume by excluding unnecessary telemetry
- Sample: Apply sampling strategies to high-volume traces
- Enrich: Add resource attributes, labels, or metadata
- Transform: Modify telemetry structure or content
- Batch: Optimize batch sizes for efficient transmission
These processors are applied consistently across your collector fleet before data reaches ClickStack.
Deploy collectors and start rollout
-
Add a collector (BDOT Collector) to your configuration:
- Navigate to Agents in Bindplane
- Install the Bindplane collector on your target systems following Bindplane’s installation instructions
- The collector will appear in your collector list once connected
-
Assign the configuration to your collectors:
- Select the collectors you want to use
- Assign your ClickStack configuration to them
-
Start a rollout:
- Click Start Rollout to deploy the configuration
- Bindplane will validate the configuration before rolling it out
- Monitor the rollout status in the Bindplane UI
Verify telemetry in ClickStack
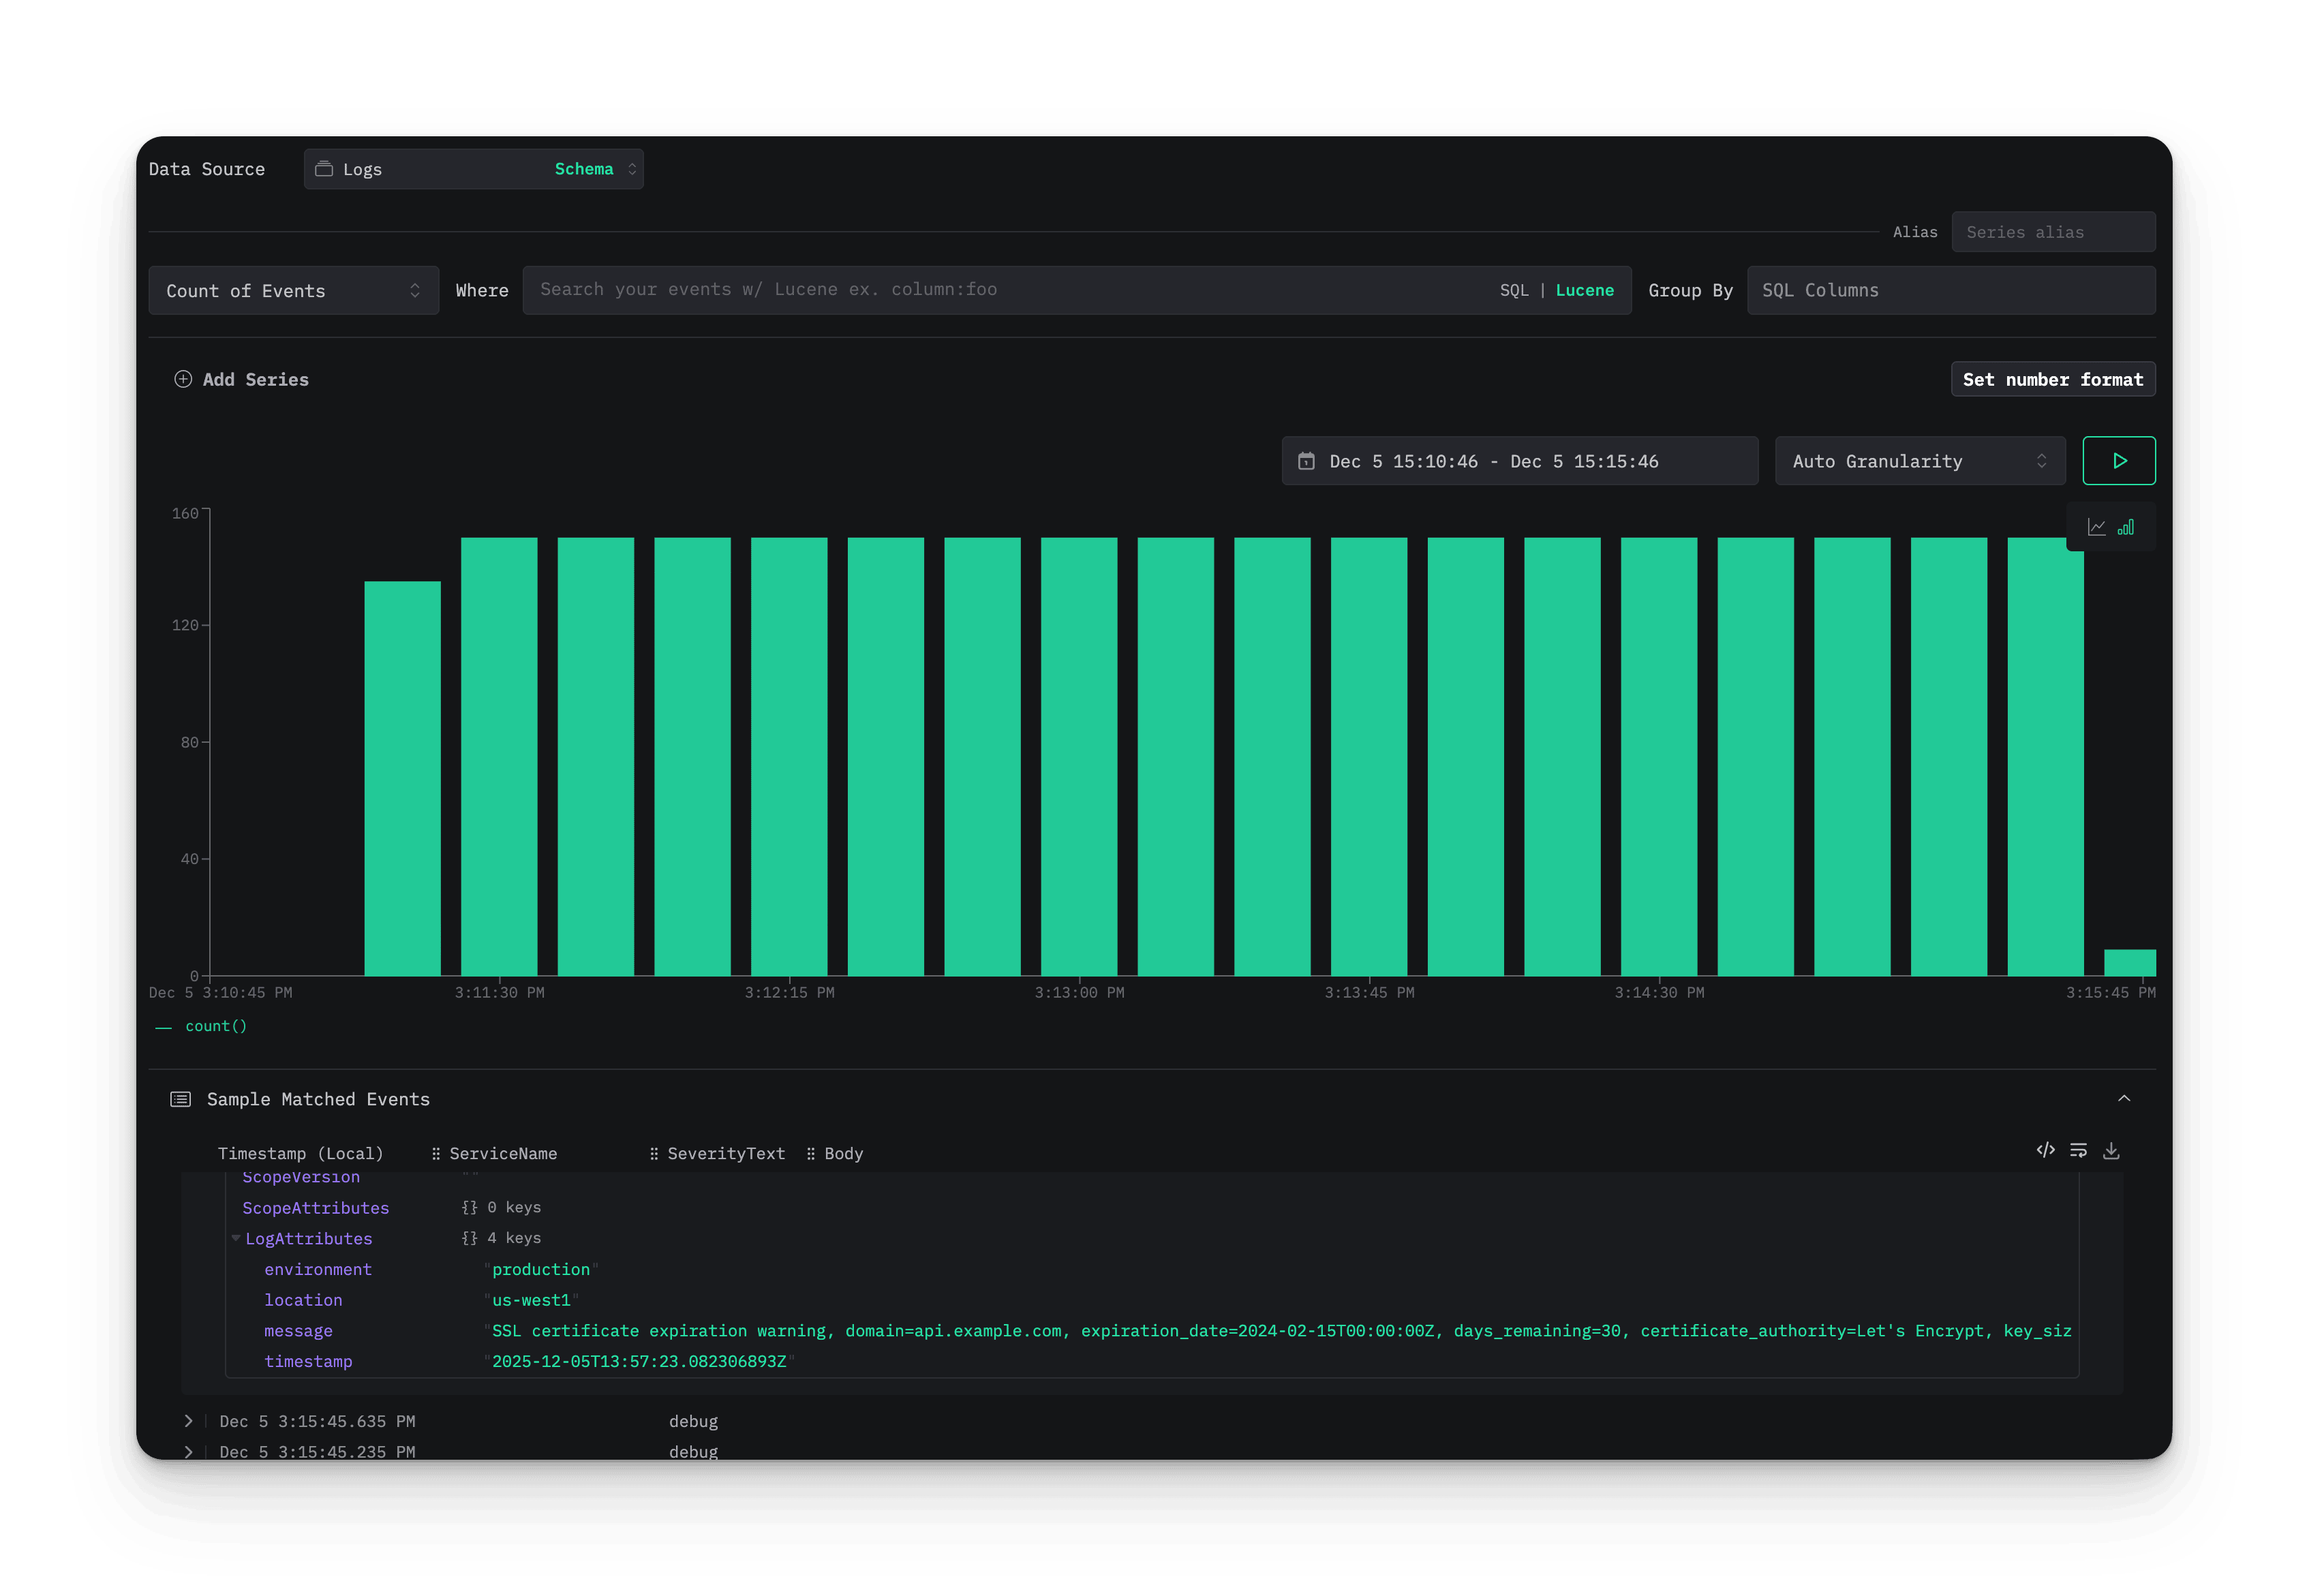
Once the configuration is rolled out, telemetry starts flowing into ClickStack from your managed collector fleet:
- Log into your ClickStack instance (HyperDX UI)
- Navigate to the Logs, Metrics, or Traces explorer
- You should see telemetry data appearing from your Bindplane-managed collectors
- Data arriving in ClickStack is already enriched and structured by Bindplane processors
Advanced configuration
Fan-out routing
Bindplane supports fan-out routing, allowing you to send the same telemetry streams to multiple destinations simultaneously. You can:
- Send logs, metrics, and traces to ClickStack for long-term storage and analysis
- Route the same data to other observability platforms for real-time alerting
- Forward specific telemetry to SIEM platforms for security analysis
This is configured by adding multiple destinations to your Bindplane configuration.
Compression and performance
For high-volume scenarios, configure compression in your ClickStack destination:
- HTTP: Supports gzip, deflate, snappy, zstd, or none (default: gzip)
- gRPC: Supports gzip, snappy, zstd, or none (default: gzip)
Compression reduces bandwidth usage when sending telemetry to ClickStack, especially important at scale.
Next steps
Now that you have telemetry flowing from Bindplane to ClickStack, you can:
- Build dashboards: Create visualizations in ClickStack (HyperDX) for logs, metrics, and traces
- Set up alerts: Configure alerts in ClickStack for critical conditions
- Scale your deployment: Add more collectors and sources as your observability needs grow
- Optimize your pipeline: Use Bindplane’s pipeline intelligence to identify optimization opportunities