

 Set up docs MCP
Integration with existing Lambda functions
This section covers configuring your existing AWS Lambda functions to send logs and traces to ClickStack using the Rotel Lambda Extension.
Prerequisites
- ClickStack instance running
- AWS Lambda functions to monitor
- AWS CLI configured with appropriate permissions
- Lambda execution role with permissions to add layers
Choose the appropriate Rotel Lambda Extension layer
Choose the Lambda layer that matches your Lambda runtime architecture. The {version} field
is dependent on the AWS region that you’re deploying into. Check the releases
page for the latest version numbers that correspond to your region.
| Architecture | ARN |
|---|---|
| x86-64/amd64 | arn:aws:lambda:{region}:418653438961:layer:rotel-extension-amd64:{version} |
| arm64 | arn:aws:lambda:{region}:418653438961:layer:rotel-extension-arm64:{version} |
Available regions:
- us-east-2, us-west-2
- eu-central-1, eu-north-1, eu-west-3
- ca-central-1
- ap-southeast-2, ap-northeast-2
- ap-south-1
- sa-east-1
Add the Rotel layer to your Lambda function
In these examples replace {arch}, {region}, and {version} with the appropriate values above.
Option 1: AWS Console
- Open the AWS Lambda console
- Navigate to your Lambda function
- Scroll to the Layers section and click Add a layer
- Select Specify an ARN
- Enter the Rotel layer ARN:
arn:aws:lambda:{region}:418653438961:layer:rotel-extension-{arch}:{version} - Click Add
Option 2: AWS CLI
aws lambda update-function-configuration \
  --function-name my-function \
  --layers arn:aws:lambda:{region}:418653438961:layer:rotel-extension-{arch}:{version}
Option 3: AWS SAM
Resources:
  MyFunction:
    Type: AWS::Serverless::Function
    Properties:
      # ... other configuration ...
      Layers:
        - arn:aws:lambda:{region}:418653438961:layer:rotel-extension-{arch}:{version}
Configure the extension to export to ClickStack
The Rotel Lambda Extension is configured using environment variables. You need to configure the OTLP exporter endpoint to point to your ClickStack instance. The examples assume your AWS Lambda function is able to reach the ClickStack instance.
Basic configuration (environment variables)
Add these environment variables to your Lambda function:
# Required: ClickStack OTLP endpoint
ROTEL_OTLP_EXPORTER_ENDPOINT=https://clickstack.example.com:4317

# Optional: Authentication headers
ROTEL_OTLP_EXPORTER_CUSTOM_HEADERS="Authorization=<YOUR_INGESTION_API_KEY>"

# Optional: Service name (defaults to Lambda function name)
ROTEL_OTEL_RESOURCE_ATTRIBUTES="service.name=my-lambda-api,service.version=1.0.0"
Advanced configuration (using .env file)
For more complex configurations, create a rotel.env file in your Lambda function bundle:
rotel.env:
ROTEL_OTLP_EXPORTER_ENDPOINT=https://clickstack.example.com:4317
ROTEL_OTLP_EXPORTER_CUSTOM_HEADERS="Authorization=<YOUR_INGESTION_API_KEY>"
ROTEL_OTEL_RESOURCE_ATTRIBUTES="service.name=my-lambda-api,deployment.environment=production"
Then set the environment variable to point to this file:
ROTEL_ENV_FILE=/var/task/rotel.envUsing AWS Secrets Manager or Parameter Store
For production deployments, store sensitive values like API keys in AWS Secrets Manager or Parameter Store:
AWS Secrets Manager Example:
ROTEL_OTLP_EXPORTER_ENDPOINT=https://clickstack.example.com:4317
ROTEL_OTLP_EXPORTER_CUSTOM_HEADERS="Authorization=${arn:aws:secretsmanager:us-east-1:123456789012:secret:clickstack-api-key-abc123}"
AWS Parameter Store Example:
ROTEL_OTLP_EXPORTER_ENDPOINT=https://clickstack.example.com:4317
ROTEL_OTLP_EXPORTER_CUSTOM_HEADERS="Authorization=${arn:aws:ssm:us-east-1:123456789012:parameter/clickstack-api-key}"
Required IAM Permissions:
Add these permissions to your Lambda execution role:
For Secrets Manager:
{
  "Version": "2012-10-17",
  "Statement": [
    {
      "Effect": "Allow",
      "Action": [
        "secretsmanager:GetSecretValue",
        "secretsmanager:BatchGetSecretValue"
      ],
      "Resource": "arn:aws:secretsmanager:us-east-1:123456789012:secret:clickstack-api-key-*"
    }
  ]
}
For Parameter Store:
{
  "Version": "2012-10-17",
  "Statement": [
    {
      "Effect": "Allow",
      "Action": [
        "ssm:GetParameters"
      ],
      "Resource": "arn:aws:ssm:us-east-1:123456789012:parameter/clickstack-api-key"
    }
  ]
}Test the integration
Invoke your Lambda function to verify logs are being sent to ClickStack:
aws lambda invoke \
  --function-name my-function \
  --payload '{"test": "data"}' \
  response.json
Check the Lambda logs for any errors:
aws logs tail /aws/lambda/my-function --followVerify logs in HyperDX
Once configured, log into HyperDX (ClickStack’s UI) and verify that logs are flowing:
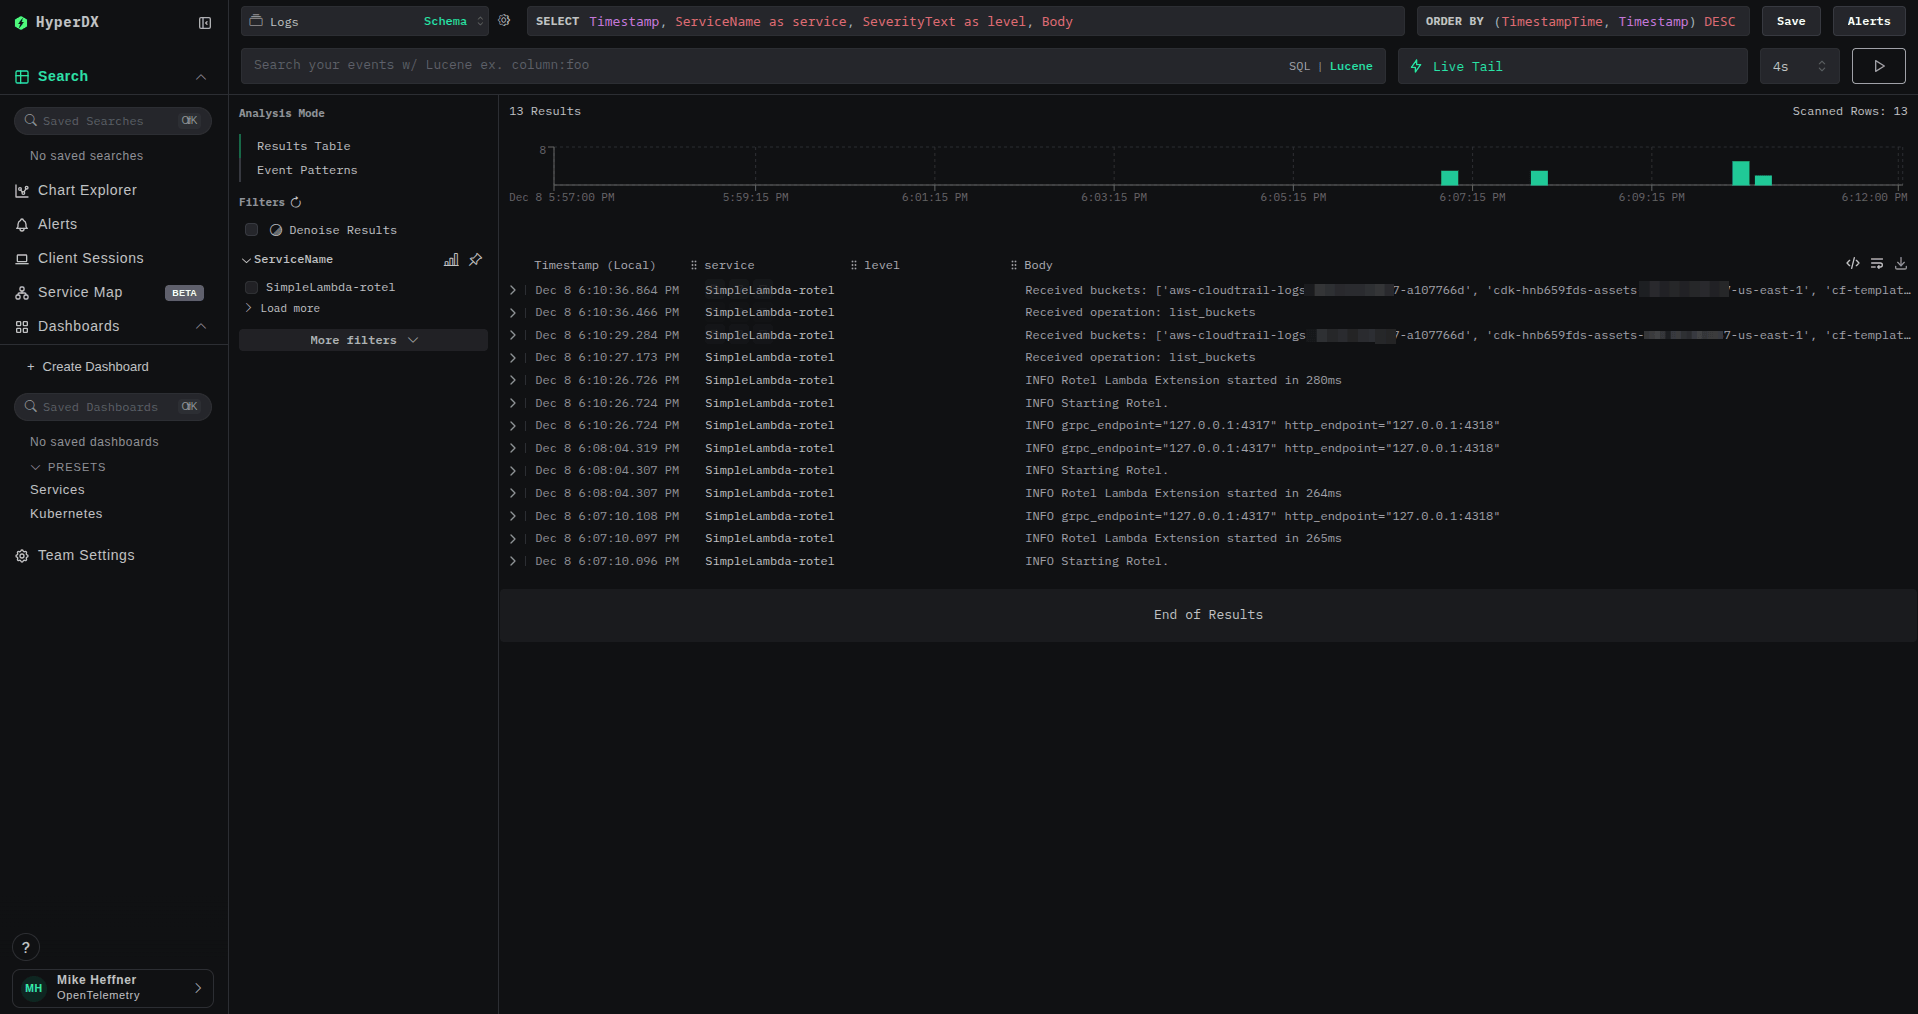
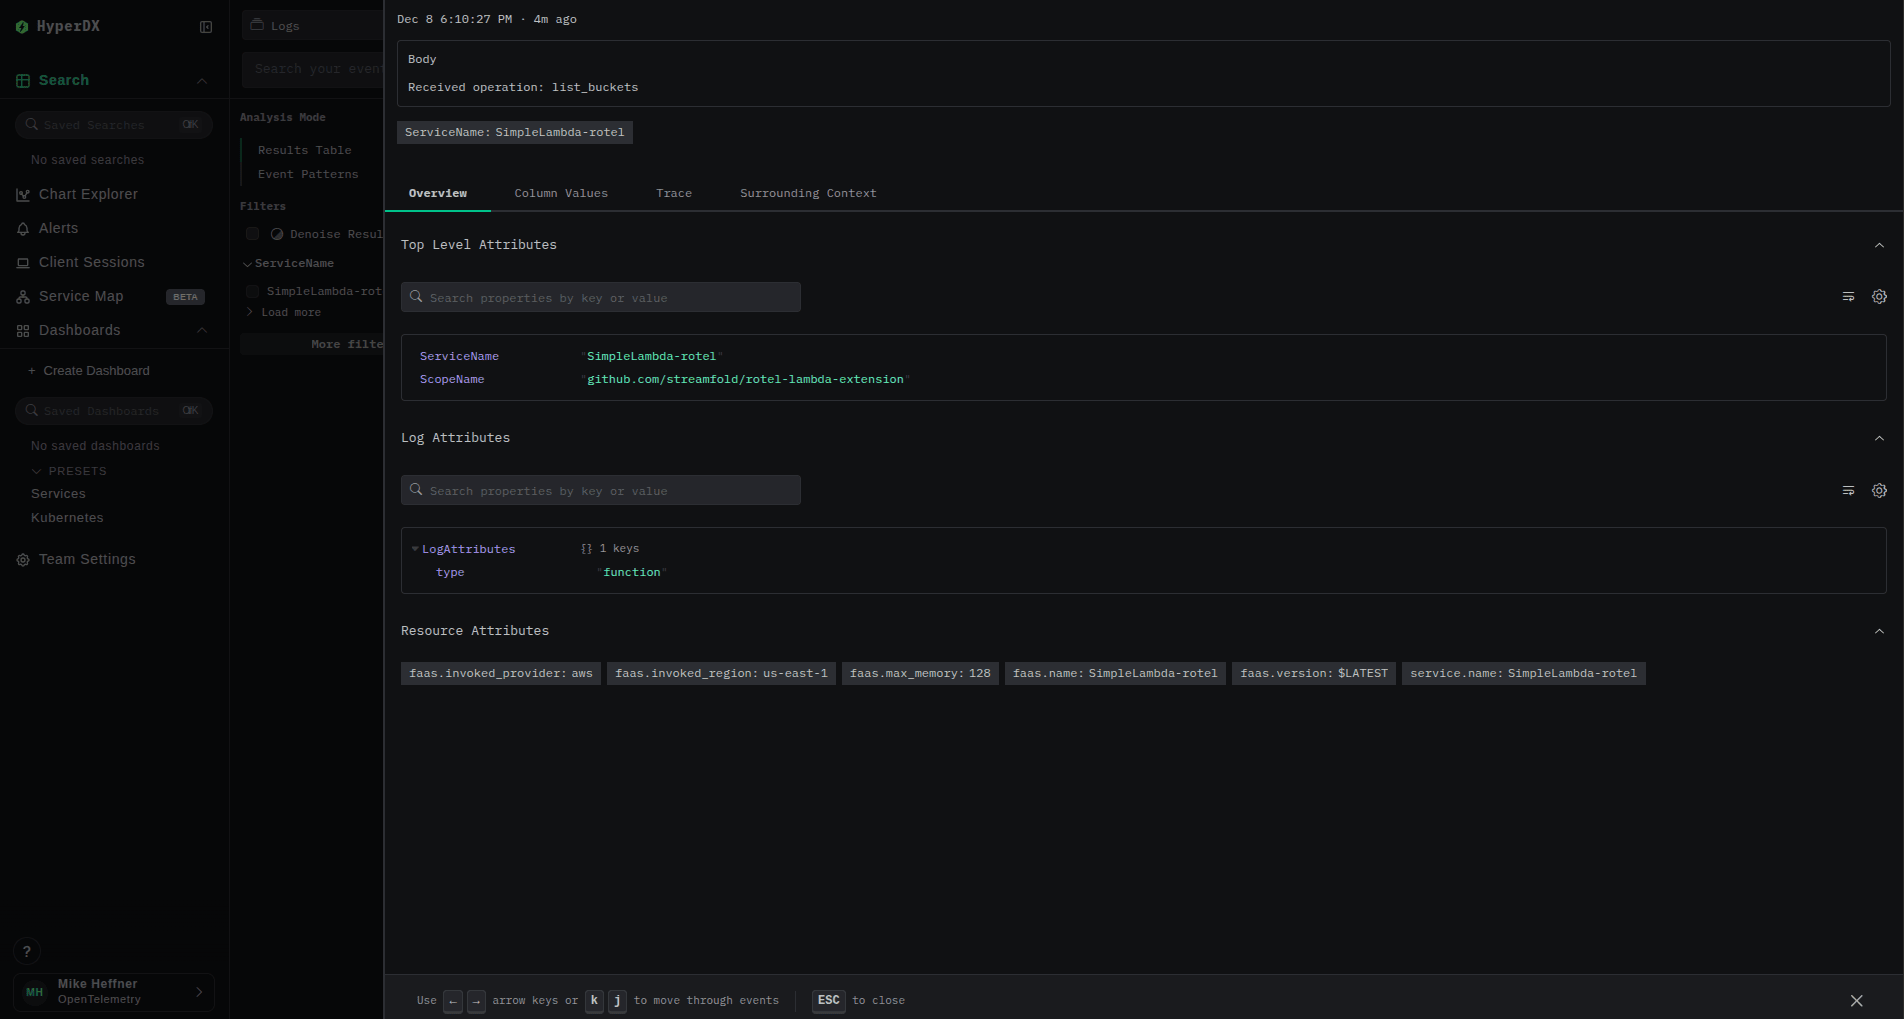
Look for these key attributes in the logs:
service.name: Your Lambda function namefaas.name: AWS Lambda function namefaas.invocation_id: Unique invocation IDcloud.provider: “aws”cloud.platform: “aws_lambda”
Disabling CloudWatch Logs (cost optimization)
By default, AWS Lambda sends all logs to CloudWatch Logs, which can be expensive at scale. Once you’ve verified that logs are flowing to ClickStack, you can disable CloudWatch logging to reduce costs.
Remove CloudWatch permissions from the execution role
- Open the AWS Console and navigate to AWS Lambda
- Navigate to your Lambda function
- Select Configuration → Permissions
- Click the execution role name to open the IAM console
- Edit the role and remove any
logs:*actions:- If using a custom policy, edit to remove
logs:CreateLogGroup,logs:CreateLogStream, andlogs:PutLogEvents - If using the AWS managed policy
AWSLambdaBasicExecutionRole, remove it from the role
- If using a custom policy, edit to remove
- Save the role
Verify CloudWatch logging is disabled
Invoke your function again and verify that:
- No new CloudWatch log streams are created
- Logs continue to appear in ClickStack/HyperDX
# This should show no new log streams after the policy change
aws logs describe-log-streams \
  --log-group-name /aws/lambda/my-function \
  --order-by LastEventTime \
  --descending \
  --max-items 5
Adding OpenTelemetry auto-instrumentation
The Rotel Lambda Extension works seamlessly with OpenTelemetry auto-instrumentation layers to collect distributed traces and metrics in addition to logs.
Choose your language instrumentation layer
AWS provides OpenTelemetry auto-instrumentation layers for multiple languages:
| Language | Layer ARN Pattern |
|---|---|
| Node.js | arn:aws:lambda:{region}:901920570463:layer:aws-otel-nodejs-{arch}-ver-{version} |
| Python | arn:aws:lambda:{region}:901920570463:layer:aws-otel-python-{arch}-ver-{version} |
| Java | arn:aws:lambda:{region}:901920570463:layer:aws-otel-java-agent-{arch}-ver-{version} |
Find the latest versions in the AWS OpenTelemetry Lambda repository.
Add both layers to your function
Add both the Rotel extension layer and the instrumentation layer:
aws lambda update-function-configuration \
  --function-name my-function \
  --layers \
    arn:aws:lambda:{region}:418653438961:layer:rotel-extension-{arch}:{version} \
    arn:aws:lambda:{region}:901920570463:layer:aws-otel-nodejs-{arch}-ver-1-30-2:1
Configure the auto-instrumentation
Set the AWS_LAMBDA_EXEC_WRAPPER environment variable to enable auto-instrumentation:
For Node.js:
AWS_LAMBDA_EXEC_WRAPPER=/opt/otel-handlerFor Python:
AWS_LAMBDA_EXEC_WRAPPER=/opt/otel-instrumentFor Java:
AWS_LAMBDA_EXEC_WRAPPER=/opt/otel-handlerVerify traces in HyperDX
After invoking your function:
- Navigate to the Traces view in HyperDX
- You should see traces with spans from your Lambda function
- Traces will be correlated with logs via
trace_idandspan_idattributes
Example applications
Checkout the example Python app demonstrating the Rotel Lambda Extension:
- Python + ClickHouse: Python application with manual OpenTelemetry instrumentation, sending traces and logs directly to ClickHouse
Join the Rotel community
If you have questions about Rotel, please join the Rotel Discord server and share your feedback or questions. Check out the Rotel Lambda Extension to contribute any improvements.
Additional resources
- Rotel Lambda Extension: Source code and detailed documentation
- Rotel Core: The lightweight OTEL data plane powering the extension