

 Set up docs MCP
Integration with existing Kafka
This section covers configuring your existing Kafka installation to send broker logs to ClickStack by modifying the ClickStack OTel collector configuration. If you would like to test the Kafka logs integration before configuring your own existing setup, you can test with our preconfigured setup and sample data in the “Demo dataset” section.
Prerequisites
- ClickStack instance running
- Existing Kafka installation (version 2.0 or newer)
- Access to Kafka log files (
server.log,controller.log, etc.)
Verify Kafka logging configuration
Kafka uses Log4j and writes logs to the directory specified by the kafka.logs.dir system property or the LOG_DIR environment variable. Check your log file location:
# Default locations
ls $KAFKA_HOME/logs/      # Standard Apache Kafka (defaults to <install-dir>/logs/)
ls /var/log/kafka/        # RPM/DEB package installations
Key Kafka log files:
server.log: General broker logs (startup, connections, replication, errors)controller.log: Controller-specific events (leader election, partition reassignment)state-change.log: Partition and replica state transitions
Kafka’s default Log4j pattern produces lines like:
[2026-03-09 14:23:45,123] INFO [KafkaServer id=0] started (kafka.server.KafkaServer)Create a custom OTel collector configuration for Kafka
ClickStack allows you to extend the base OpenTelemetry Collector configuration by mounting a custom configuration file and setting an environment variable. The custom configuration is merged with the base configuration managed by HyperDX via OpAMP.
Create a file named kafka-logs-monitoring.yaml with the following configuration:
receivers:
  filelog/kafka:
    include:
      - /var/log/kafka/server.log
      - /var/log/kafka/controller.log  # optional, only exists if log4j is configured with separate file appenders
      - /var/log/kafka/state-change.log  # optional, same as above
    start_at: beginning
    multiline:
      line_start_pattern: '^\[\d{4}-\d{2}-\d{2}'
    operators:
      - type: regex_parser
        regex: '^\[(?P<timestamp>\d{4}-\d{2}-\d{2} \d{2}:\d{2}:\d{2},\d{3})\] (?P<severity>\w+) (?P<message>.*)'
        parse_from: body
        parse_to: attributes
        timestamp:
          parse_from: attributes.timestamp
          layout: '%Y-%m-%d %H:%M:%S,%L'
        severity:
          parse_from: attributes.severity

      - type: move
        from: attributes.message
        to: body

      - type: add
        field: attributes.source
        value: "kafka"

      - type: add
        field: resource["service.name"]
        value: "kafka-production"

service:
  pipelines:
    logs/kafka:
      receivers: [filelog/kafka]
      processors:
        - memory_limiter
        - transform
        - batch
      exporters:
- clickhouseConfigure ClickStack to load custom configuration
To enable custom collector configuration in your existing ClickStack deployment, you must:
- Mount the custom config file at
/etc/otelcol-contrib/custom.config.yaml - Set the environment variable
CUSTOM_OTELCOL_CONFIG_FILE=/etc/otelcol-contrib/custom.config.yaml - Mount your Kafka log directory so the collector can read them
Update your ClickStack deployment configuration:
services:
  clickstack:
    # ... existing configuration ...
    environment:
      - CUSTOM_OTELCOL_CONFIG_FILE=/etc/otelcol-contrib/custom.config.yaml
      # ... other environment variables ...
    volumes:
      - ./kafka-logs-monitoring.yaml:/etc/otelcol-contrib/custom.config.yaml:ro
      - /var/log/kafka:/var/log/kafka:ro
      # ... other volumes ...
If you’re using the all-in-one image with docker, run:
docker run --name clickstack \
  -p 8080:8080 -p 4317:4317 -p 4318:4318 \
  -e CUSTOM_OTELCOL_CONFIG_FILE=/etc/otelcol-contrib/custom.config.yaml \
  -v "$(pwd)/kafka-logs-monitoring.yaml:/etc/otelcol-contrib/custom.config.yaml:ro" \
  -v /var/log/kafka:/var/log/kafka:ro \
clickhouse/clickstack-all-in-one:latestVerify Logs in HyperDX
Once configured, log into HyperDX and verify that logs are flowing:
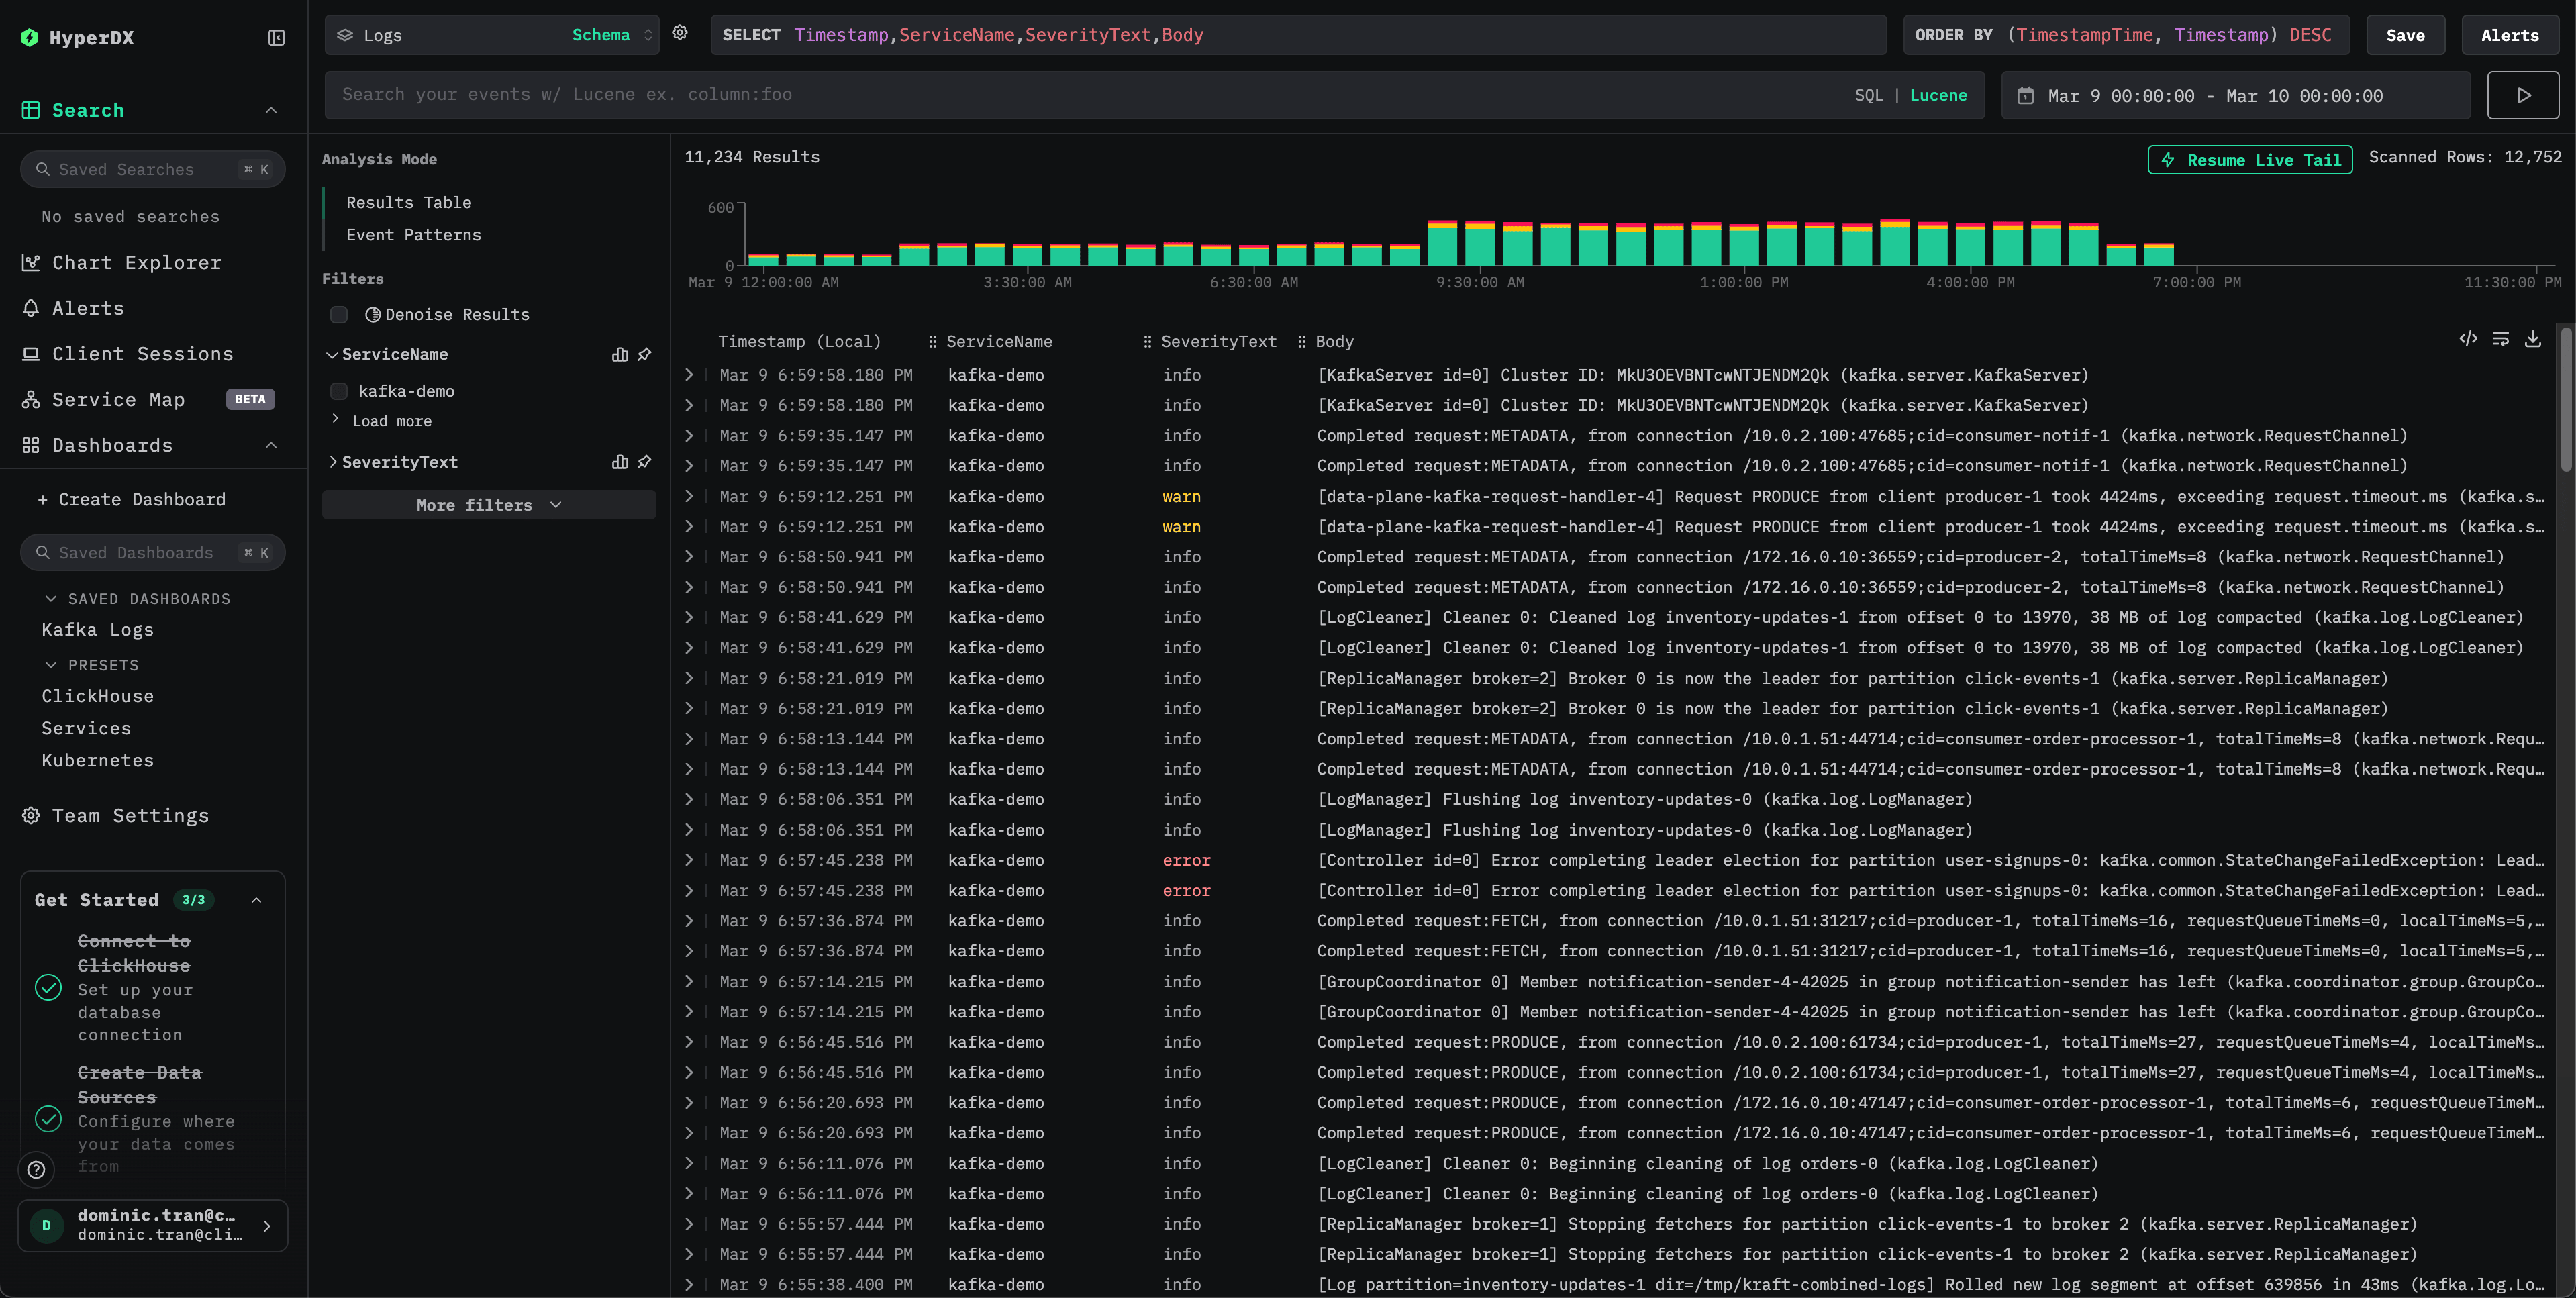
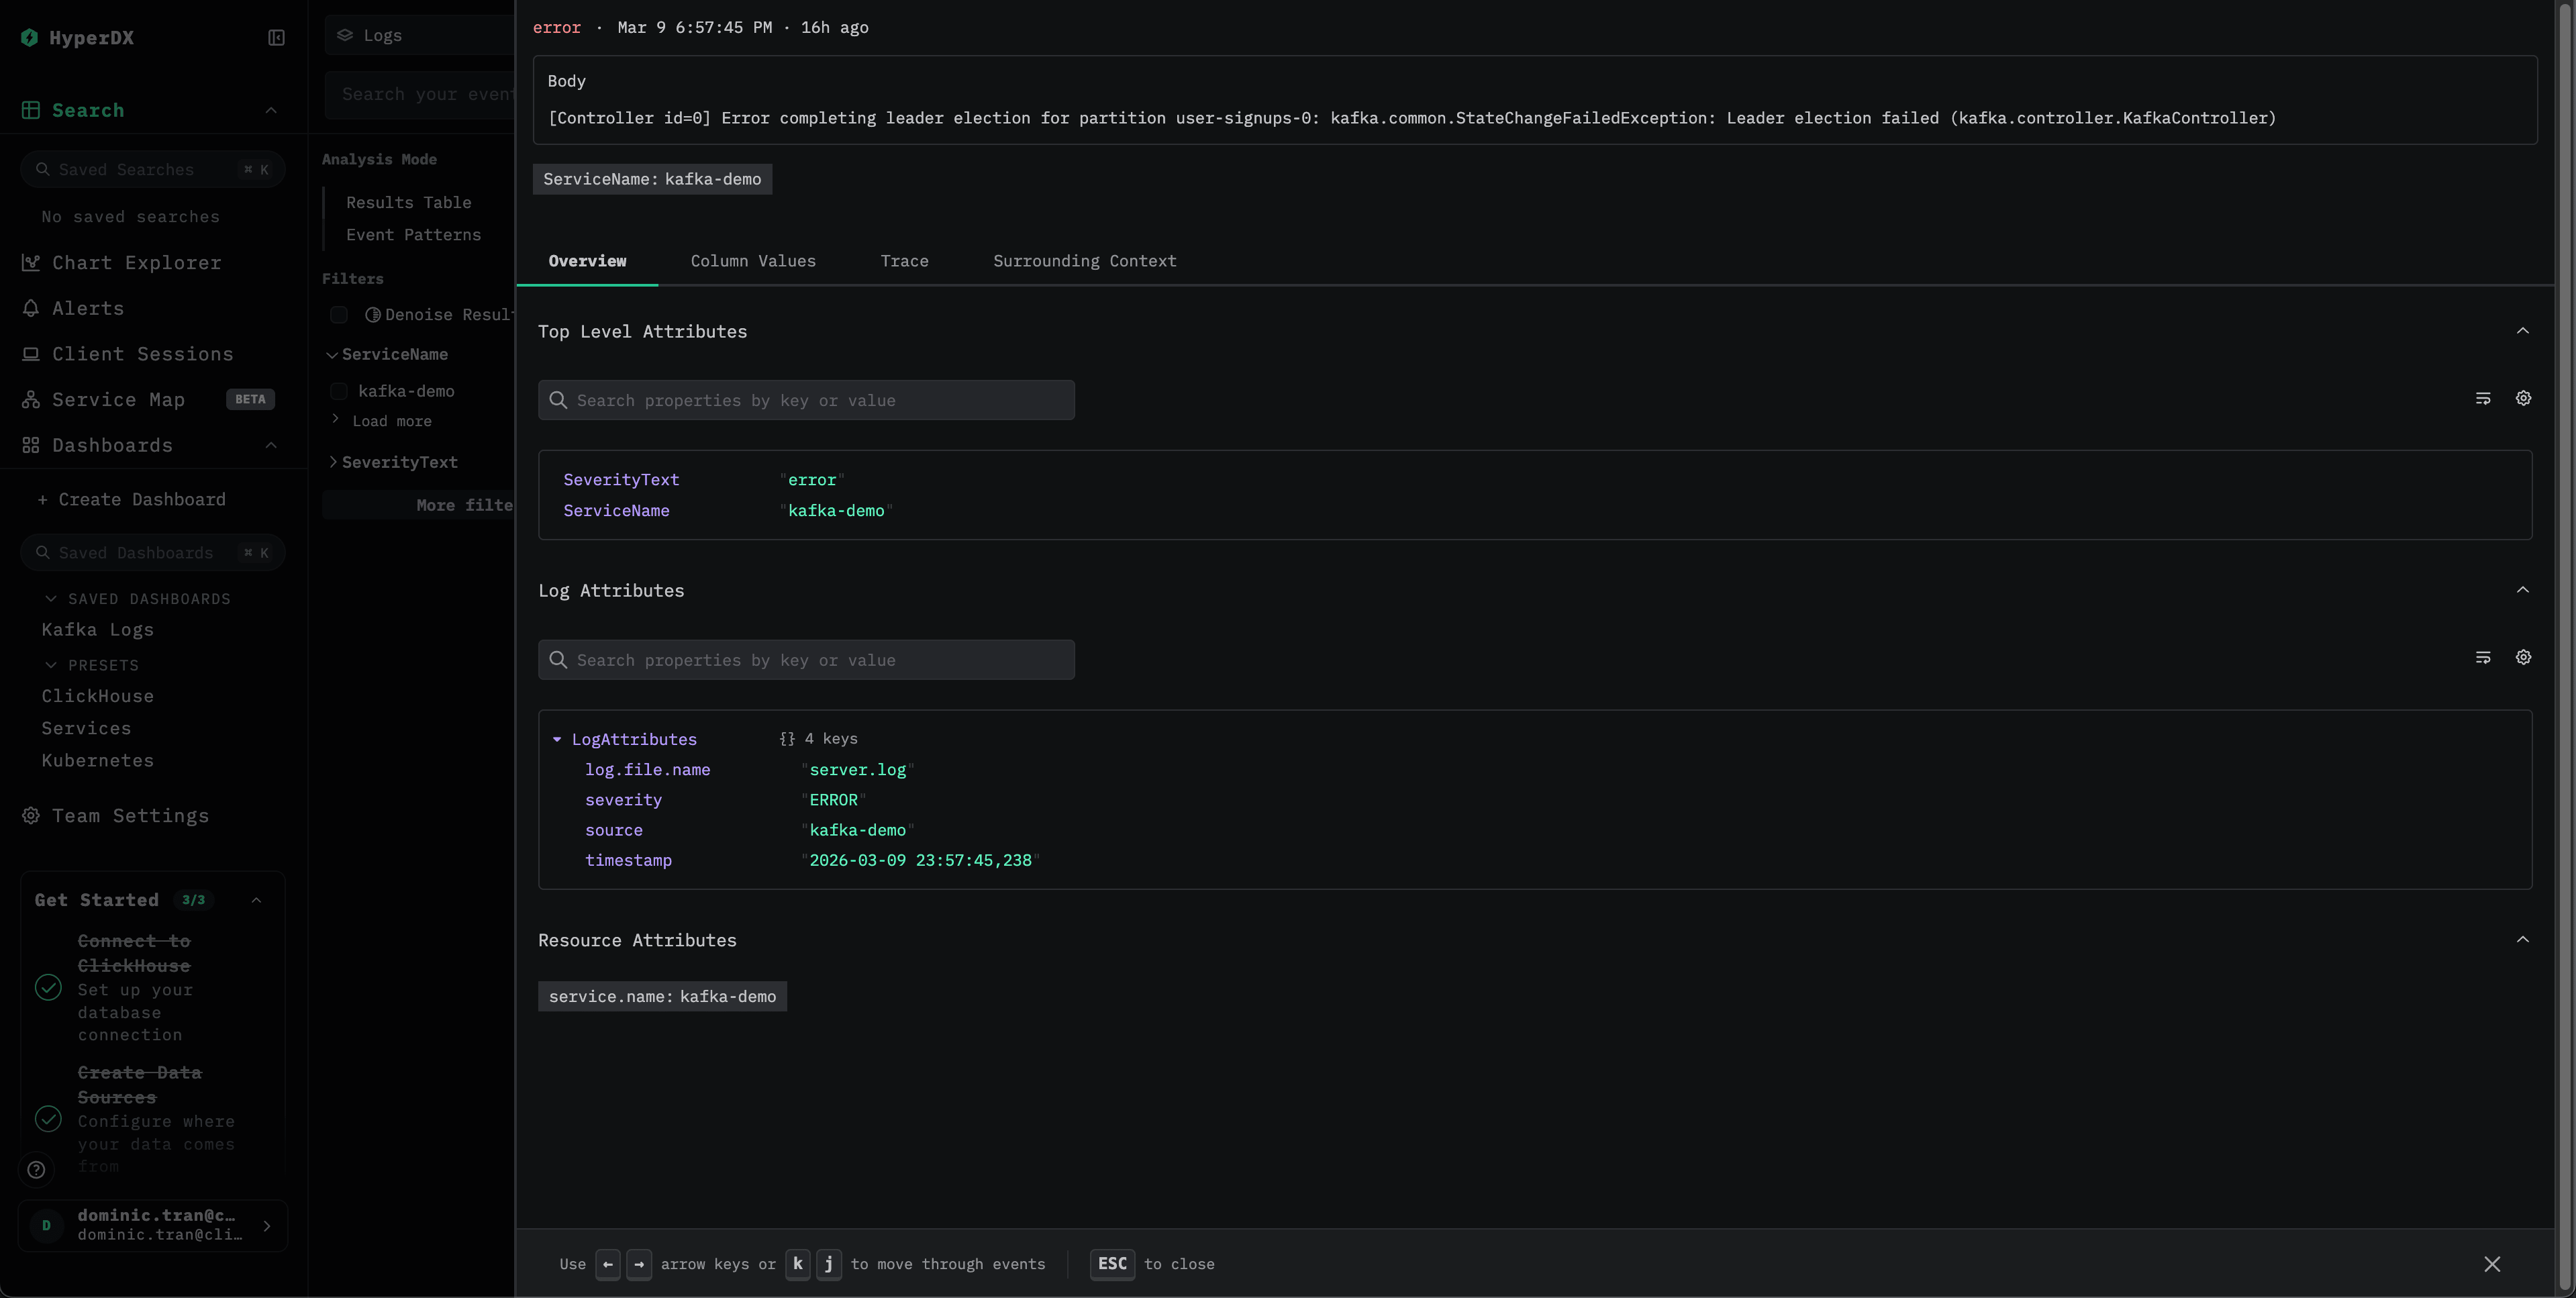
Demo dataset
Test the Kafka logs integration with a pre-generated sample dataset before configuring your production systems.
Download the sample dataset
Download the sample log file:
curl -O https://datasets-documentation.s3.eu-west-3.amazonaws.com/clickstack-integrations/kafka/server.logCreate test collector configuration
Create a file named kafka-logs-demo.yaml with the following configuration:
cat > kafka-logs-demo.yaml << 'EOF'
receivers:
  filelog/kafka:
    include:
      - /tmp/kafka-demo/server.log
    start_at: beginning
    multiline:
      line_start_pattern: '^\[\d{4}-\d{2}-\d{2}'
    operators:
      - type: regex_parser
        regex: '^\[(?P<timestamp>\d{4}-\d{2}-\d{2} \d{2}:\d{2}:\d{2},\d{3})\] (?P<severity>\w+) (?P<message>.*)'
        parse_from: body
        parse_to: attributes
        timestamp:
          parse_from: attributes.timestamp
          layout: '%Y-%m-%d %H:%M:%S,%L'
        severity:
          parse_from: attributes.severity

      - type: move
        from: attributes.message
        to: body

      - type: add
        field: attributes.source
        value: "kafka-demo"

      - type: add
        field: resource["service.name"]
        value: "kafka-demo"

service:
  pipelines:
    logs/kafka-demo:
      receivers: [filelog/kafka]
      processors:
        - memory_limiter
        - transform
        - batch
      exporters:
        - clickhouse
EOF
Run ClickStack with demo configuration
Run ClickStack with the demo logs and configuration:
docker run --name clickstack-demo \
  -p 8080:8080 -p 4317:4317 -p 4318:4318 \
  -e CUSTOM_OTELCOL_CONFIG_FILE=/etc/otelcol-contrib/custom.config.yaml \
  -v "$(pwd)/kafka-logs-demo.yaml:/etc/otelcol-contrib/custom.config.yaml:ro" \
  -v "$(pwd)/server.log:/tmp/kafka-demo/server.log:ro" \
  clickhouse/clickstack-all-in-one:latest
Verify logs in HyperDX
Once ClickStack is running:
- Open HyperDX and log in to your account (you may need to create an account first)
- Navigate to the Search view and set the source to
Logs - Set the time range to include 2026-03-09 00:00:00 - 2026-03-10 00:00:00 (UTC)
Dashboards and visualization
Download the dashboard configuration
Import pre-built dashboard
- Open HyperDX and navigate to the Dashboards section.
- Click “Import Dashboard” in the upper right corner under the ellipses.

- Upload the kafka-logs-dashboard.json file and click finish import.
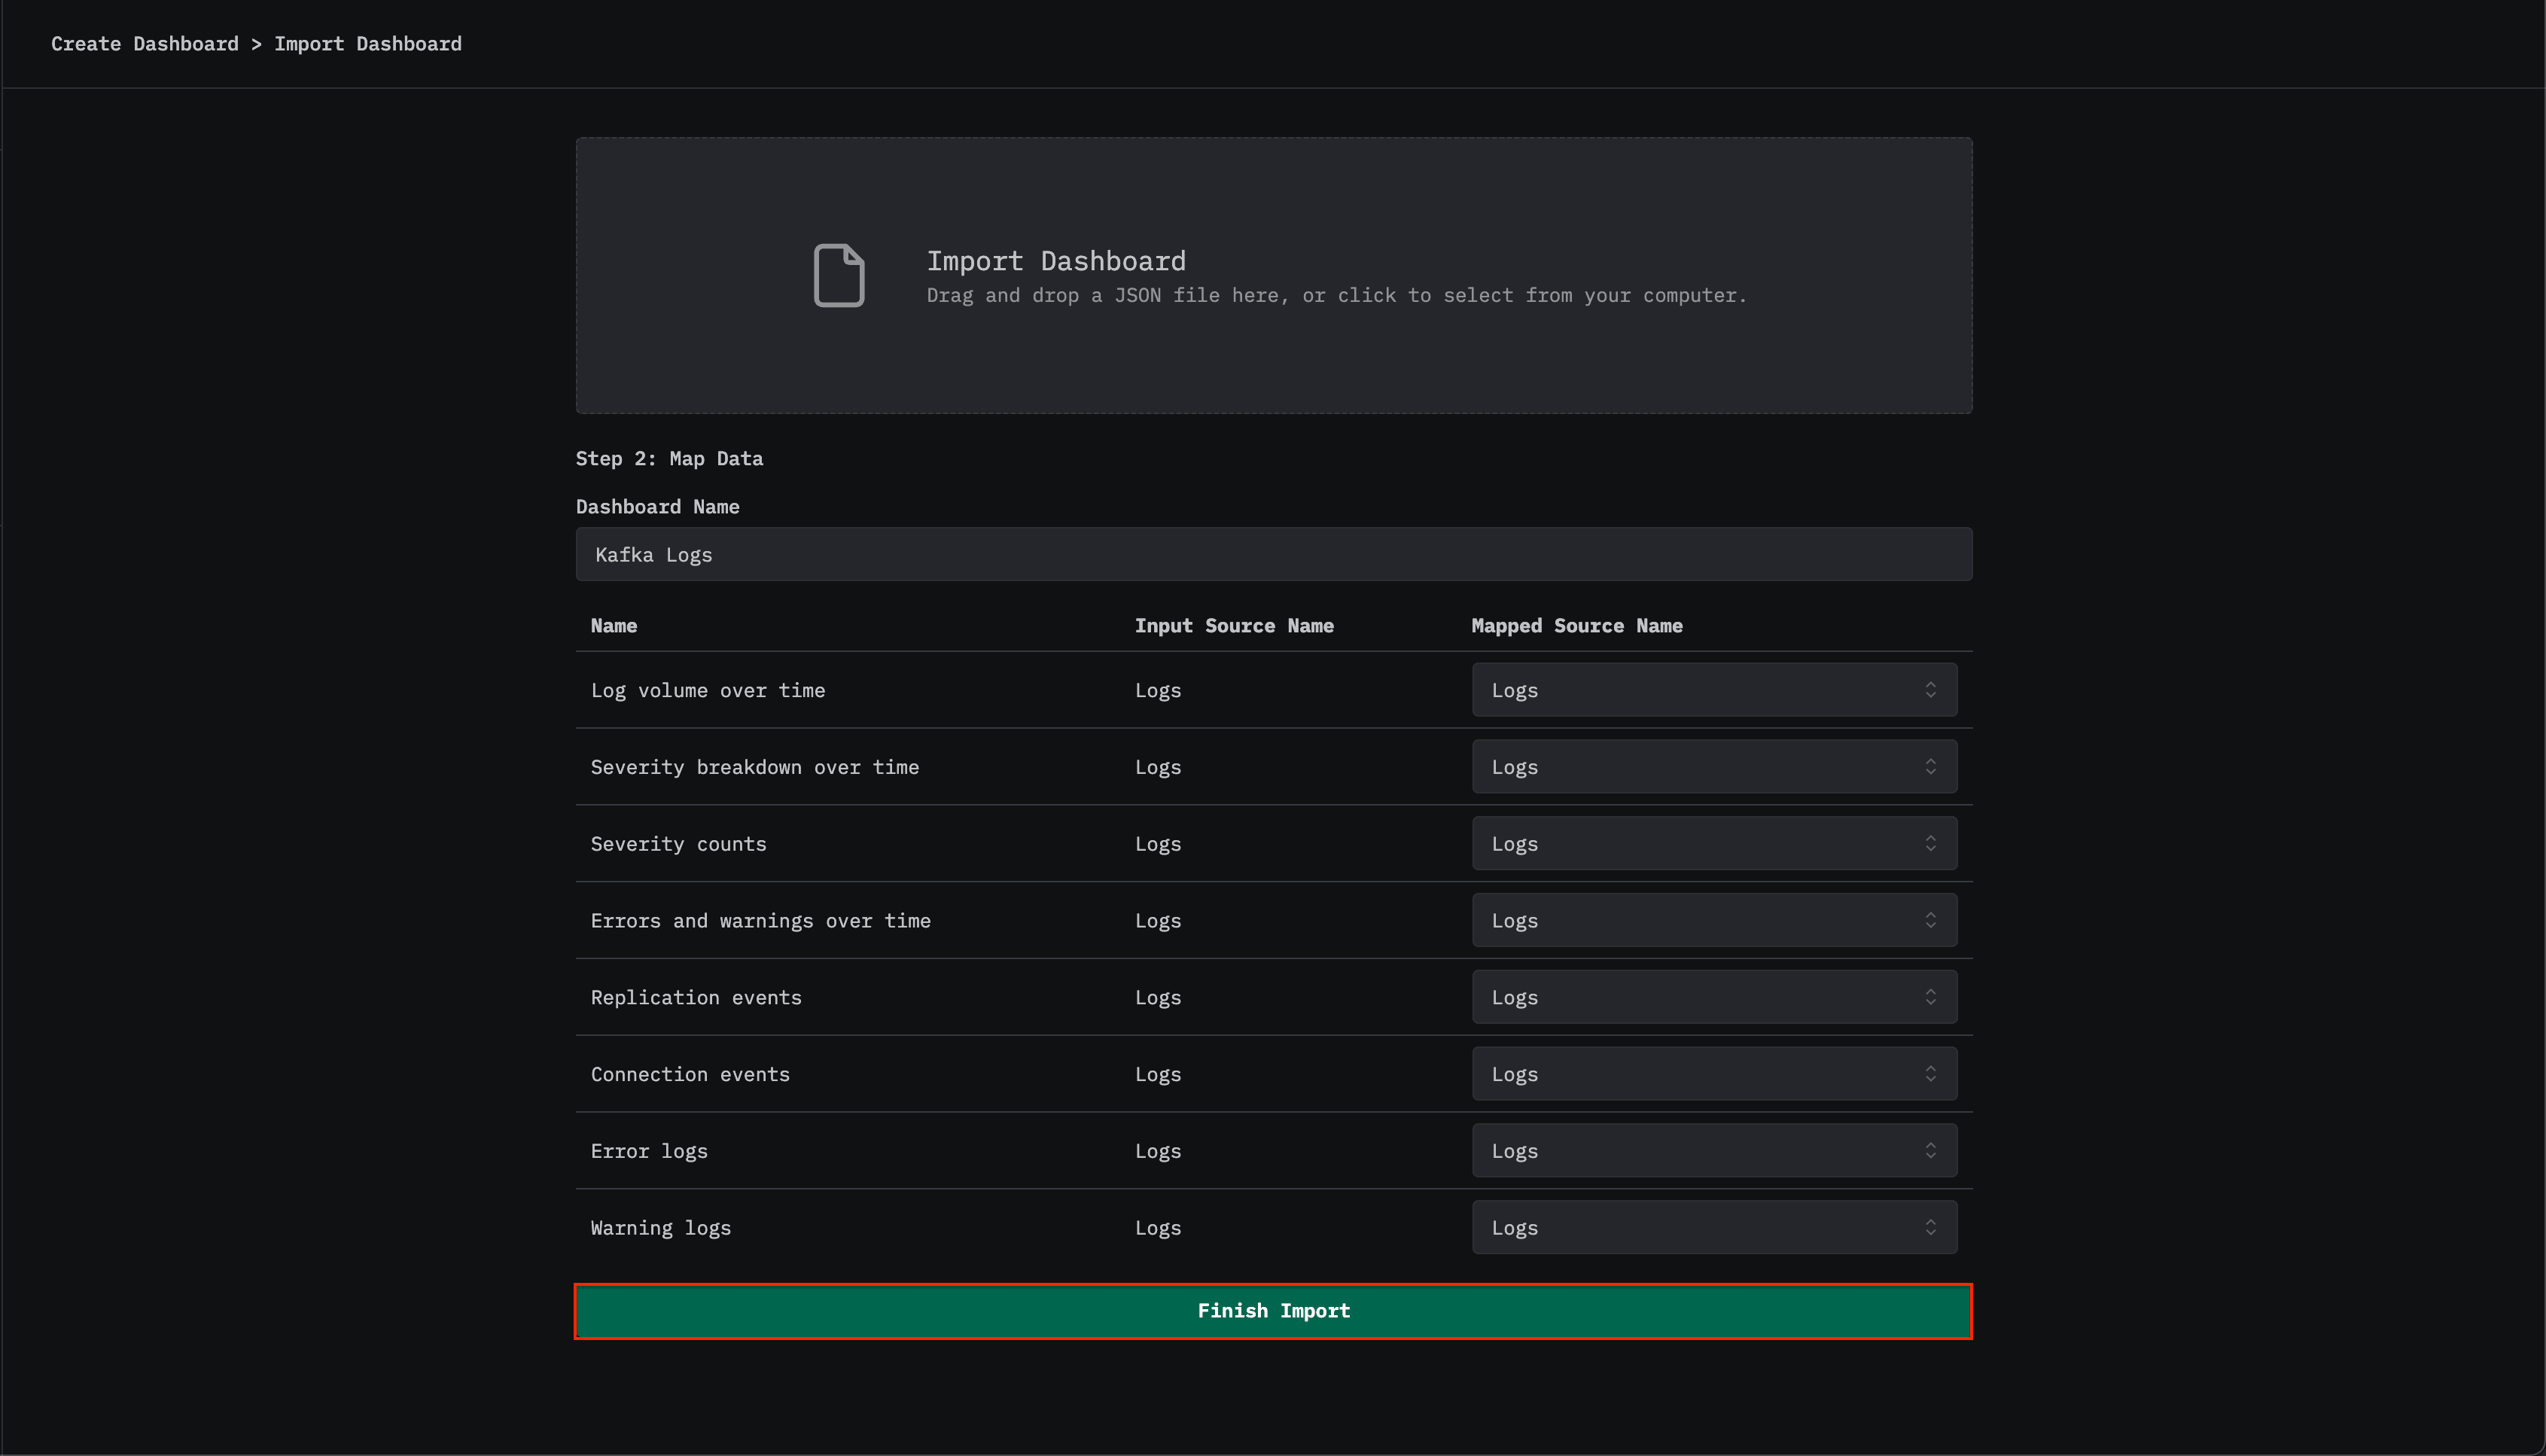
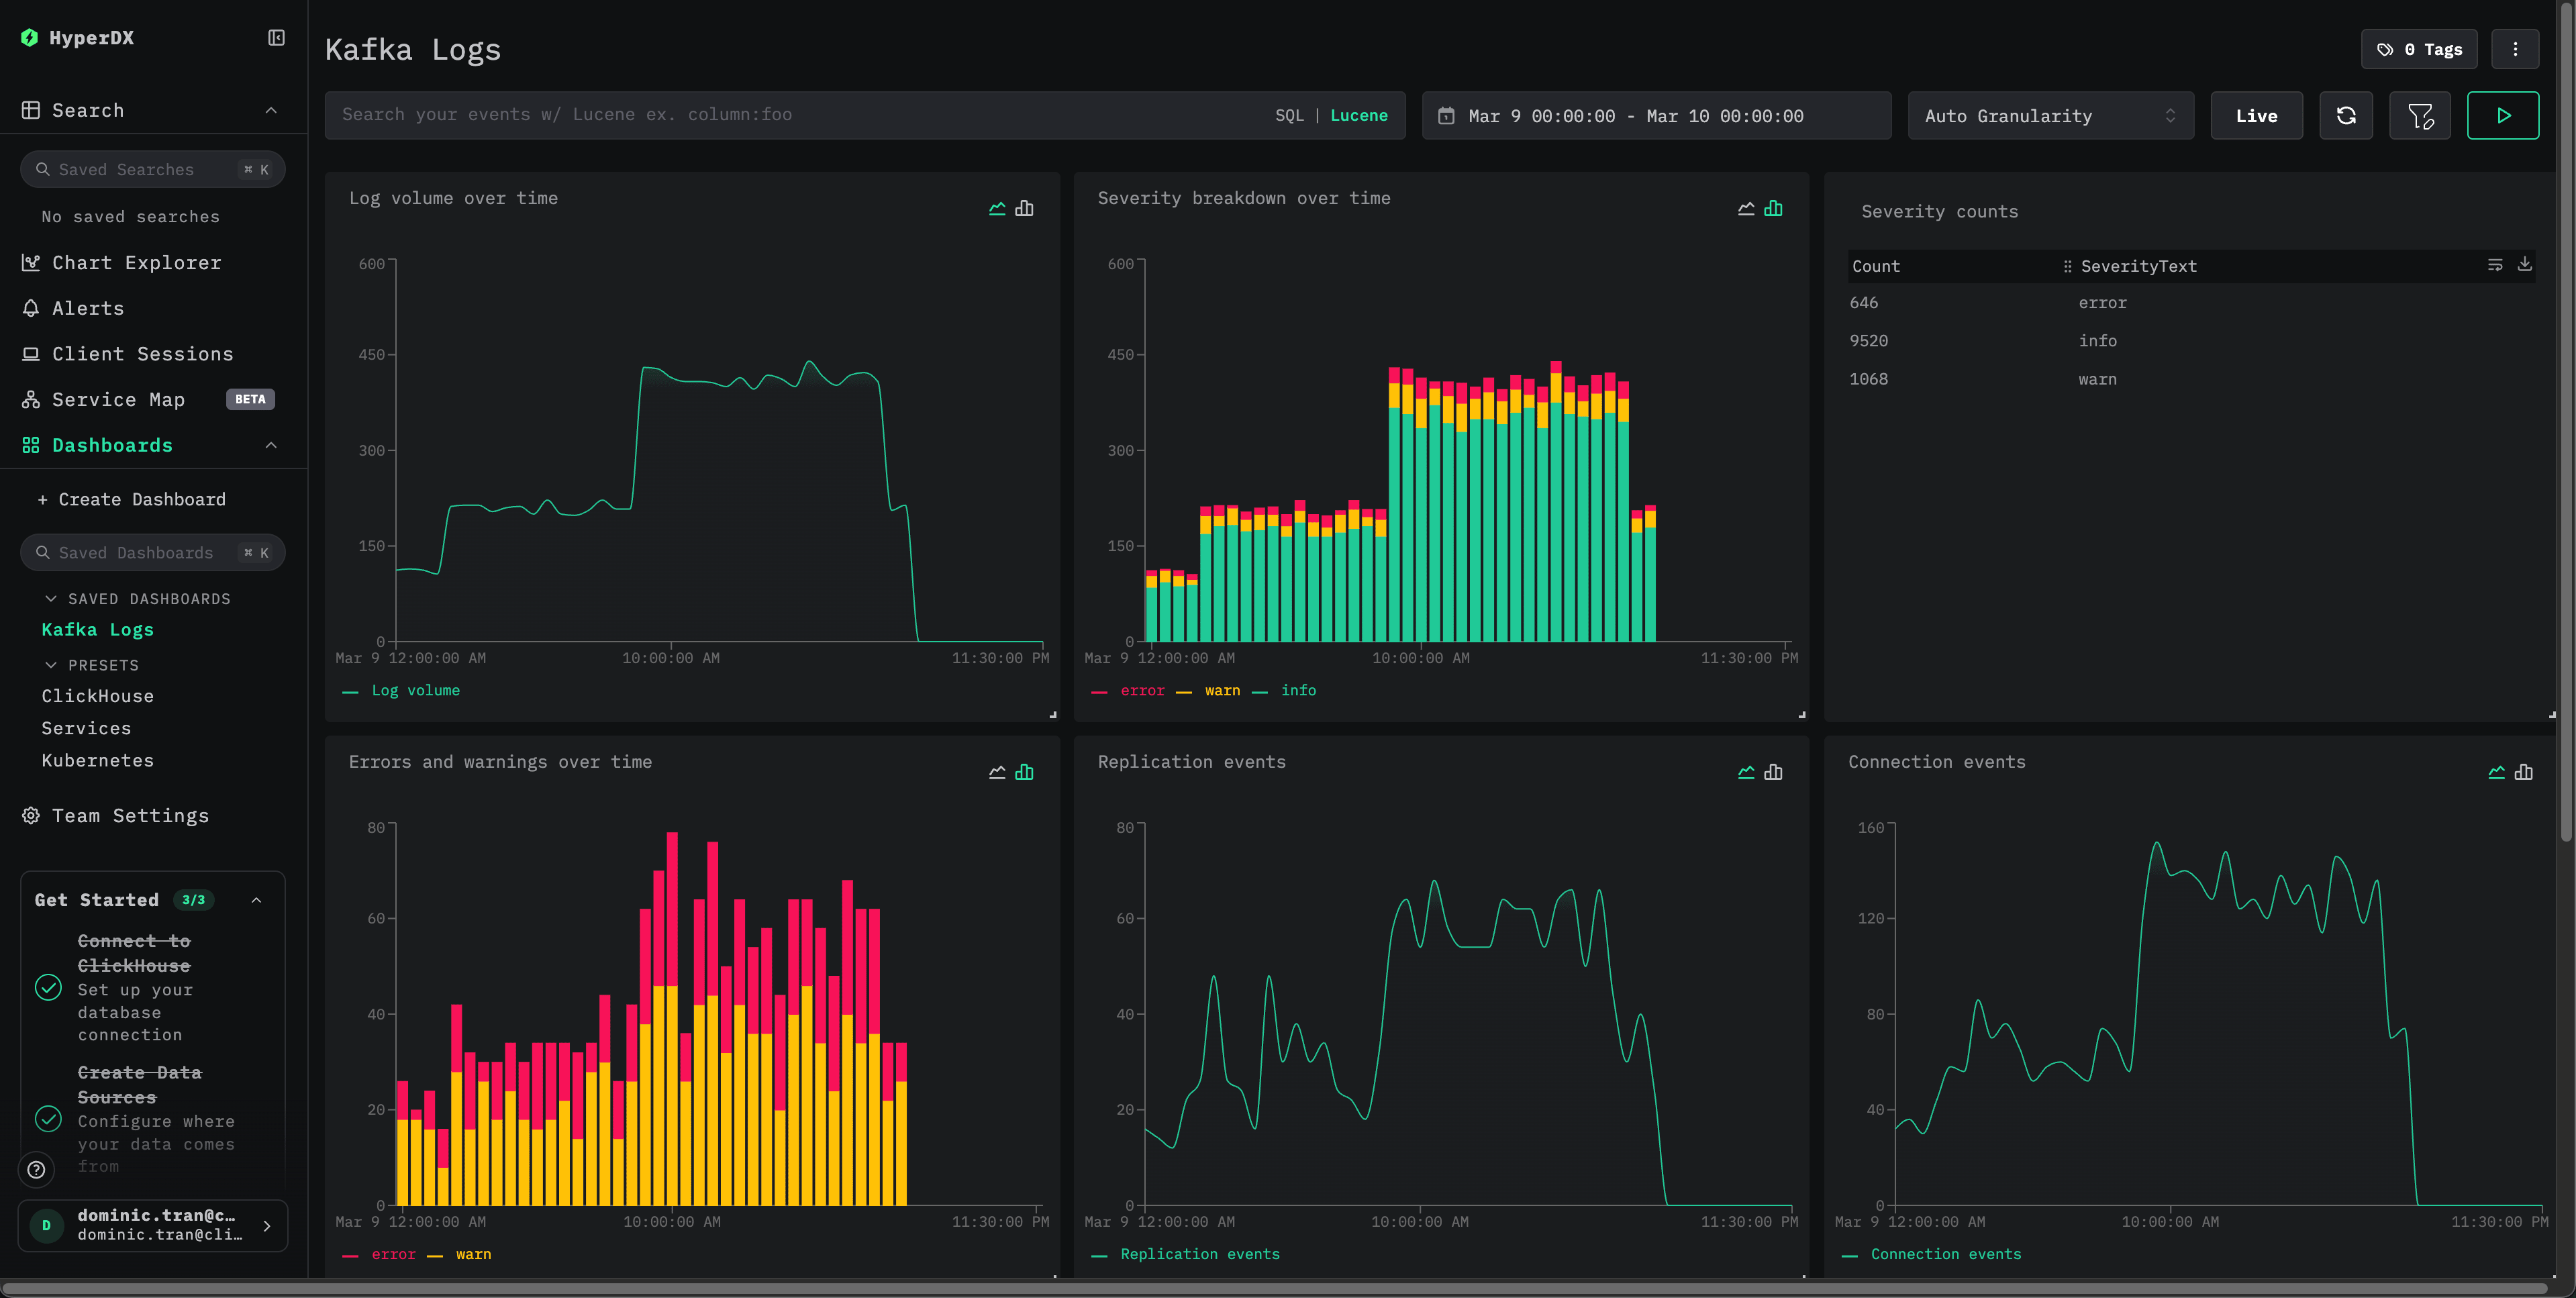
The dashboard will be created with all visualizations pre-configured
For the demo dataset, set the time range to include 2026-03-09 00:00:00 - 2026-03-10 00:00:00 (UTC).
Troubleshooting
Verify the effective config includes your filelog receiver:
docker exec <container> cat /etc/otel/supervisor-data/effective.yaml | grep -A 10 filelogCheck for collector errors:
docker exec <container> cat /etc/otel/supervisor-data/agent.logVerify Kafka log format matches the expected pattern:
tail -1 /var/log/kafka/server.logIf your Kafka installation uses a custom Log4j pattern, adjust the regex_parser regex accordingly.
Next steps
- Set up alerts for critical events (broker failures, replication errors, consumer group issues)
- Combine with Kafka Metrics for comprehensive Kafka monitoring
- Create additional dashboards for specific use cases (controller events, partition reassignment)
Going to production
This guide extends ClickStack’s built-in OpenTelemetry Collector for quick setup. For production deployments, we recommend running your own OTel Collector and sending data to ClickStack’s OTLP endpoint. See Sending OpenTelemetry data for production configuration.