

 Set up docs MCP
Integration with existing Redis
This section covers configuring your existing Redis installation to send metrics to ClickStack by configuring the ClickStack OTel collector with the Redis receiver.
If you would like to test the Redis Metrics integration before configuring your own existing setup, you can test with our preconfigured demo dataset in the following section.
Prerequisites
- ClickStack instance running
- Existing Redis installation (version 3.0 or newer)
- Network access from ClickStack to Redis (default port 6379)
- Redis password if authentication is enabled
Verify Redis connection
First, verify you can connect to Redis and that the INFO command works:
# Test connection
redis-cli ping
# Expected output: PONG

# Test INFO command (used by metrics collector)
redis-cli INFO server
# Should display Redis server information
If Redis requires authentication:
redis-cli -a <your-password> pingCommon Redis endpoints:
- Local installation:
localhost:6379 - Docker: Use container name or service name (e.g.,
redis:6379) - Remote:
<redis-host>:6379
Create custom OTel collector configuration
ClickStack allows you to extend the base OpenTelemetry collector configuration by mounting a custom configuration file and setting an environment variable. The custom configuration is merged with the base configuration managed by HyperDX via OpAMP.
Create a file named redis-metrics.yaml with the following configuration:
receivers:
  redis:
    endpoint: "localhost:6379"
    collection_interval: 10s
    # Uncomment if Redis requires authentication
    # password: ${env:REDIS_PASSWORD}

    # Configure which metrics to collect
    metrics:
      redis.commands.processed:
        enabled: true
      redis.clients.connected:
        enabled: true
      redis.memory.used:
        enabled: true
      redis.keyspace.hits:
        enabled: true
      redis.keyspace.misses:
        enabled: true
      redis.keys.evicted:
        enabled: true
      redis.keys.expired:
        enabled: true

processors:
  resource:
    attributes:
      - key: service.name
        value: "redis"
        action: upsert

service:
  pipelines:
    metrics/redis:
      receivers: [redis]
      processors:
        - resource
        - memory_limiter
        - batch
      exporters:
        - clickhouse
This configuration:
- Connects to Redis on
localhost:6379(adjust endpoint for your setup) - Collects metrics every 10 seconds
- Collects key performance metrics (commands, clients, memory, keyspace stats)
- Sets the required
service.nameresource attribute per OpenTelemetry semantic conventions - Routes metrics to the ClickHouse exporter via a dedicated pipeline
Key metrics collected:
redis.commands.processed- Commands processed per secondredis.clients.connected- Number of connected clientsredis.clients.blocked- Clients blocked on blocking callsredis.memory.used- Memory used by Redis in bytesredis.memory.peak- Peak memory usageredis.keyspace.hits- Successful key lookupsredis.keyspace.misses- Failed key lookups (for cache hit rate calculation)redis.keys.expired- Keys expiredredis.keys.evicted- Keys evicted due to memory pressureredis.connections.received- Total connections receivedredis.connections.rejected- Rejected connections
Configure ClickStack to load custom configuration
To enable custom collector configuration in your existing ClickStack deployment, you must:
- Mount the custom config file at
/etc/otelcol-contrib/custom.config.yaml - Set the environment variable
CUSTOM_OTELCOL_CONFIG_FILE=/etc/otelcol-contrib/custom.config.yaml - Ensure network connectivity between ClickStack and Redis
Option 1: Docker Compose
Update your ClickStack deployment configuration:
services:
  clickstack:
    # ... existing configuration ...
    environment:
      - CUSTOM_OTELCOL_CONFIG_FILE=/etc/otelcol-contrib/custom.config.yaml
      # Optional: If Redis requires authentication
      # - REDIS_PASSWORD=your-redis-password
      # ... other environment variables ...
    volumes:
      - ./redis-metrics.yaml:/etc/otelcol-contrib/custom.config.yaml:ro
      # ... other volumes ...
    # If Redis is in the same compose file:
    depends_on:
      - redis

  redis:
    image: redis:7-alpine
    ports:
      - "6379:6379"
    # Optional: Enable authentication
    # command: redis-server --requirepass your-redis-password
Option 2: Docker run (all-in-one image)
If using the all-in-one image with docker run:
docker run --name clickstack \
  -p 8080:8080 -p 4317:4317 -p 4318:4318 \
  -e CUSTOM_OTELCOL_CONFIG_FILE=/etc/otelcol-contrib/custom.config.yaml \
  -v "$(pwd)/redis-metrics.yaml:/etc/otelcol-contrib/custom.config.yaml:ro" \
  clickhouse/clickstack-all-in-one:latest
Important: If Redis is running in another container, use Docker networking:
# Create a network
docker network create monitoring

# Run Redis on the network
docker run -d --name redis --network monitoring redis:7-alpine

# Run ClickStack on the same network (update endpoint to "redis:6379" in config)
docker run --name clickstack \
  --network monitoring \
  -p 8080:8080 -p 4317:4317 -p 4318:4318 \
  -e CUSTOM_OTELCOL_CONFIG_FILE=/etc/otelcol-contrib/custom.config.yaml \
  -v "$(pwd)/redis-metrics.yaml:/etc/otelcol-contrib/custom.config.yaml:ro" \
  clickhouse/clickstack-all-in-one:latest
Verify metrics in HyperDX
Once configured, log into HyperDX and verify metrics are flowing:
- Navigate to the Metrics explorer
- Search for metrics starting with
redis.(e.g.,redis.commands.processed,redis.memory.used) - You should see metric data points appearing at your configured collection interval
Demo dataset
For users who want to test the Redis Metrics integration before configuring their production systems, we provide a pre-generated dataset with realistic Redis Metrics patterns.
Download the sample metrics dataset
Download the pre-generated metrics files (24 hours of Redis Metrics with realistic patterns):
# Download gauge metrics (memory, fragmentation ratio)
curl -O https://datasets-documentation.s3.eu-west-3.amazonaws.com/clickstack-integrations/redis/redis-metrics-gauge.csv

# Download sum metrics (commands, connections, keyspace stats)
curl -O https://datasets-documentation.s3.eu-west-3.amazonaws.com/clickstack-integrations/redis/redis-metrics-sum.csv
The dataset includes realistic patterns:
- Cache warming event (06:00) - Hit rate climbs from 30% to 80%
- Traffic spike (14:30-14:45) - 5x traffic surge with connection pressure
- Memory pressure (20:00) - Key evictions and cache performance degradation
- Daily traffic patterns - Business hours peaks, evening drops, random micro-spikes
Start ClickStack
Start a ClickStack instance:
docker run -d --name clickstack-demo \
  -p 8080:8080 -p 4317:4317 -p 4318:4318 \
  clickhouse/clickstack-all-in-one:latest
Wait approximately 30 seconds for ClickStack to fully start.
Load metrics into ClickStack
Load the metrics directly into ClickHouse:
# Load gauge metrics (memory, fragmentation)
cat redis-metrics-gauge.csv | docker exec -i clickstack-demo \
  clickhouse-client --query "INSERT INTO otel_metrics_gauge FORMAT CSVWithNames"

# Load sum metrics (commands, connections, keyspace)
cat redis-metrics-sum.csv | docker exec -i clickstack-demo \
  clickhouse-client --query "INSERT INTO otel_metrics_sum FORMAT CSVWithNames"
Verify metrics in HyperDX
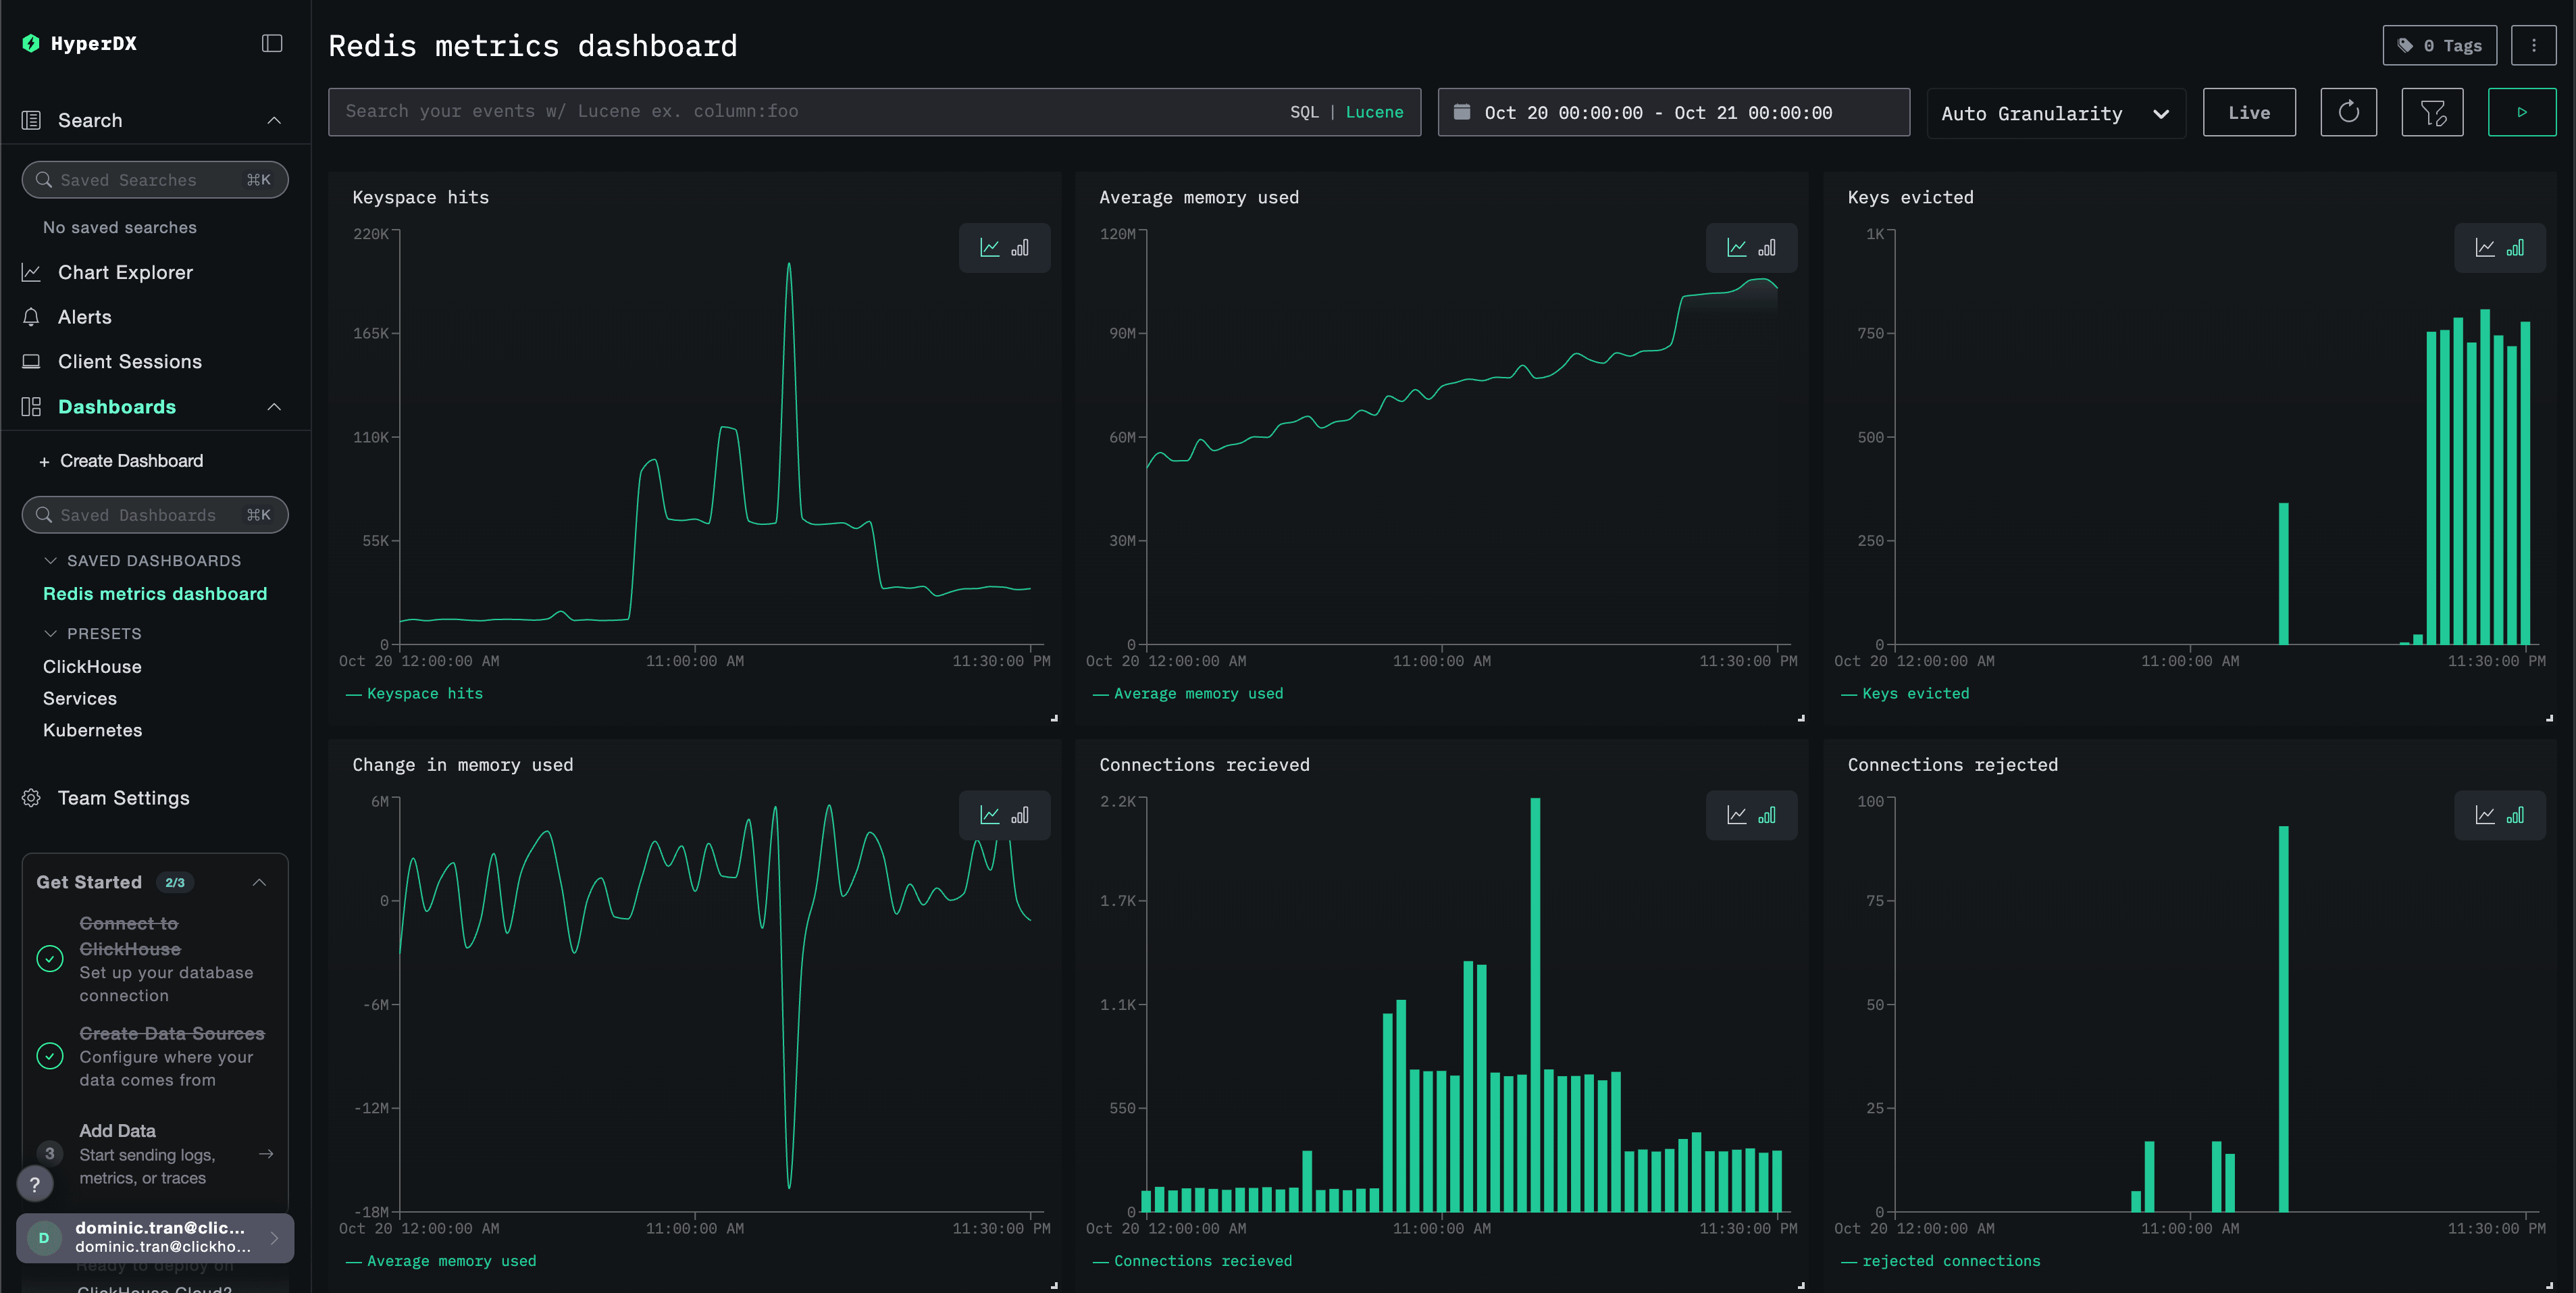
Once loaded, the quickest way to see your metrics is through the pre-built dashboard.
Proceed to the Dashboards and visualization section to import the dashboard and view all Redis Metrics at once.
Dashboards and visualization
To help you get started monitoring Redis with ClickStack, we provide essential visualizations for Redis Metrics.
Download the dashboard configuration
Import the pre-built dashboard
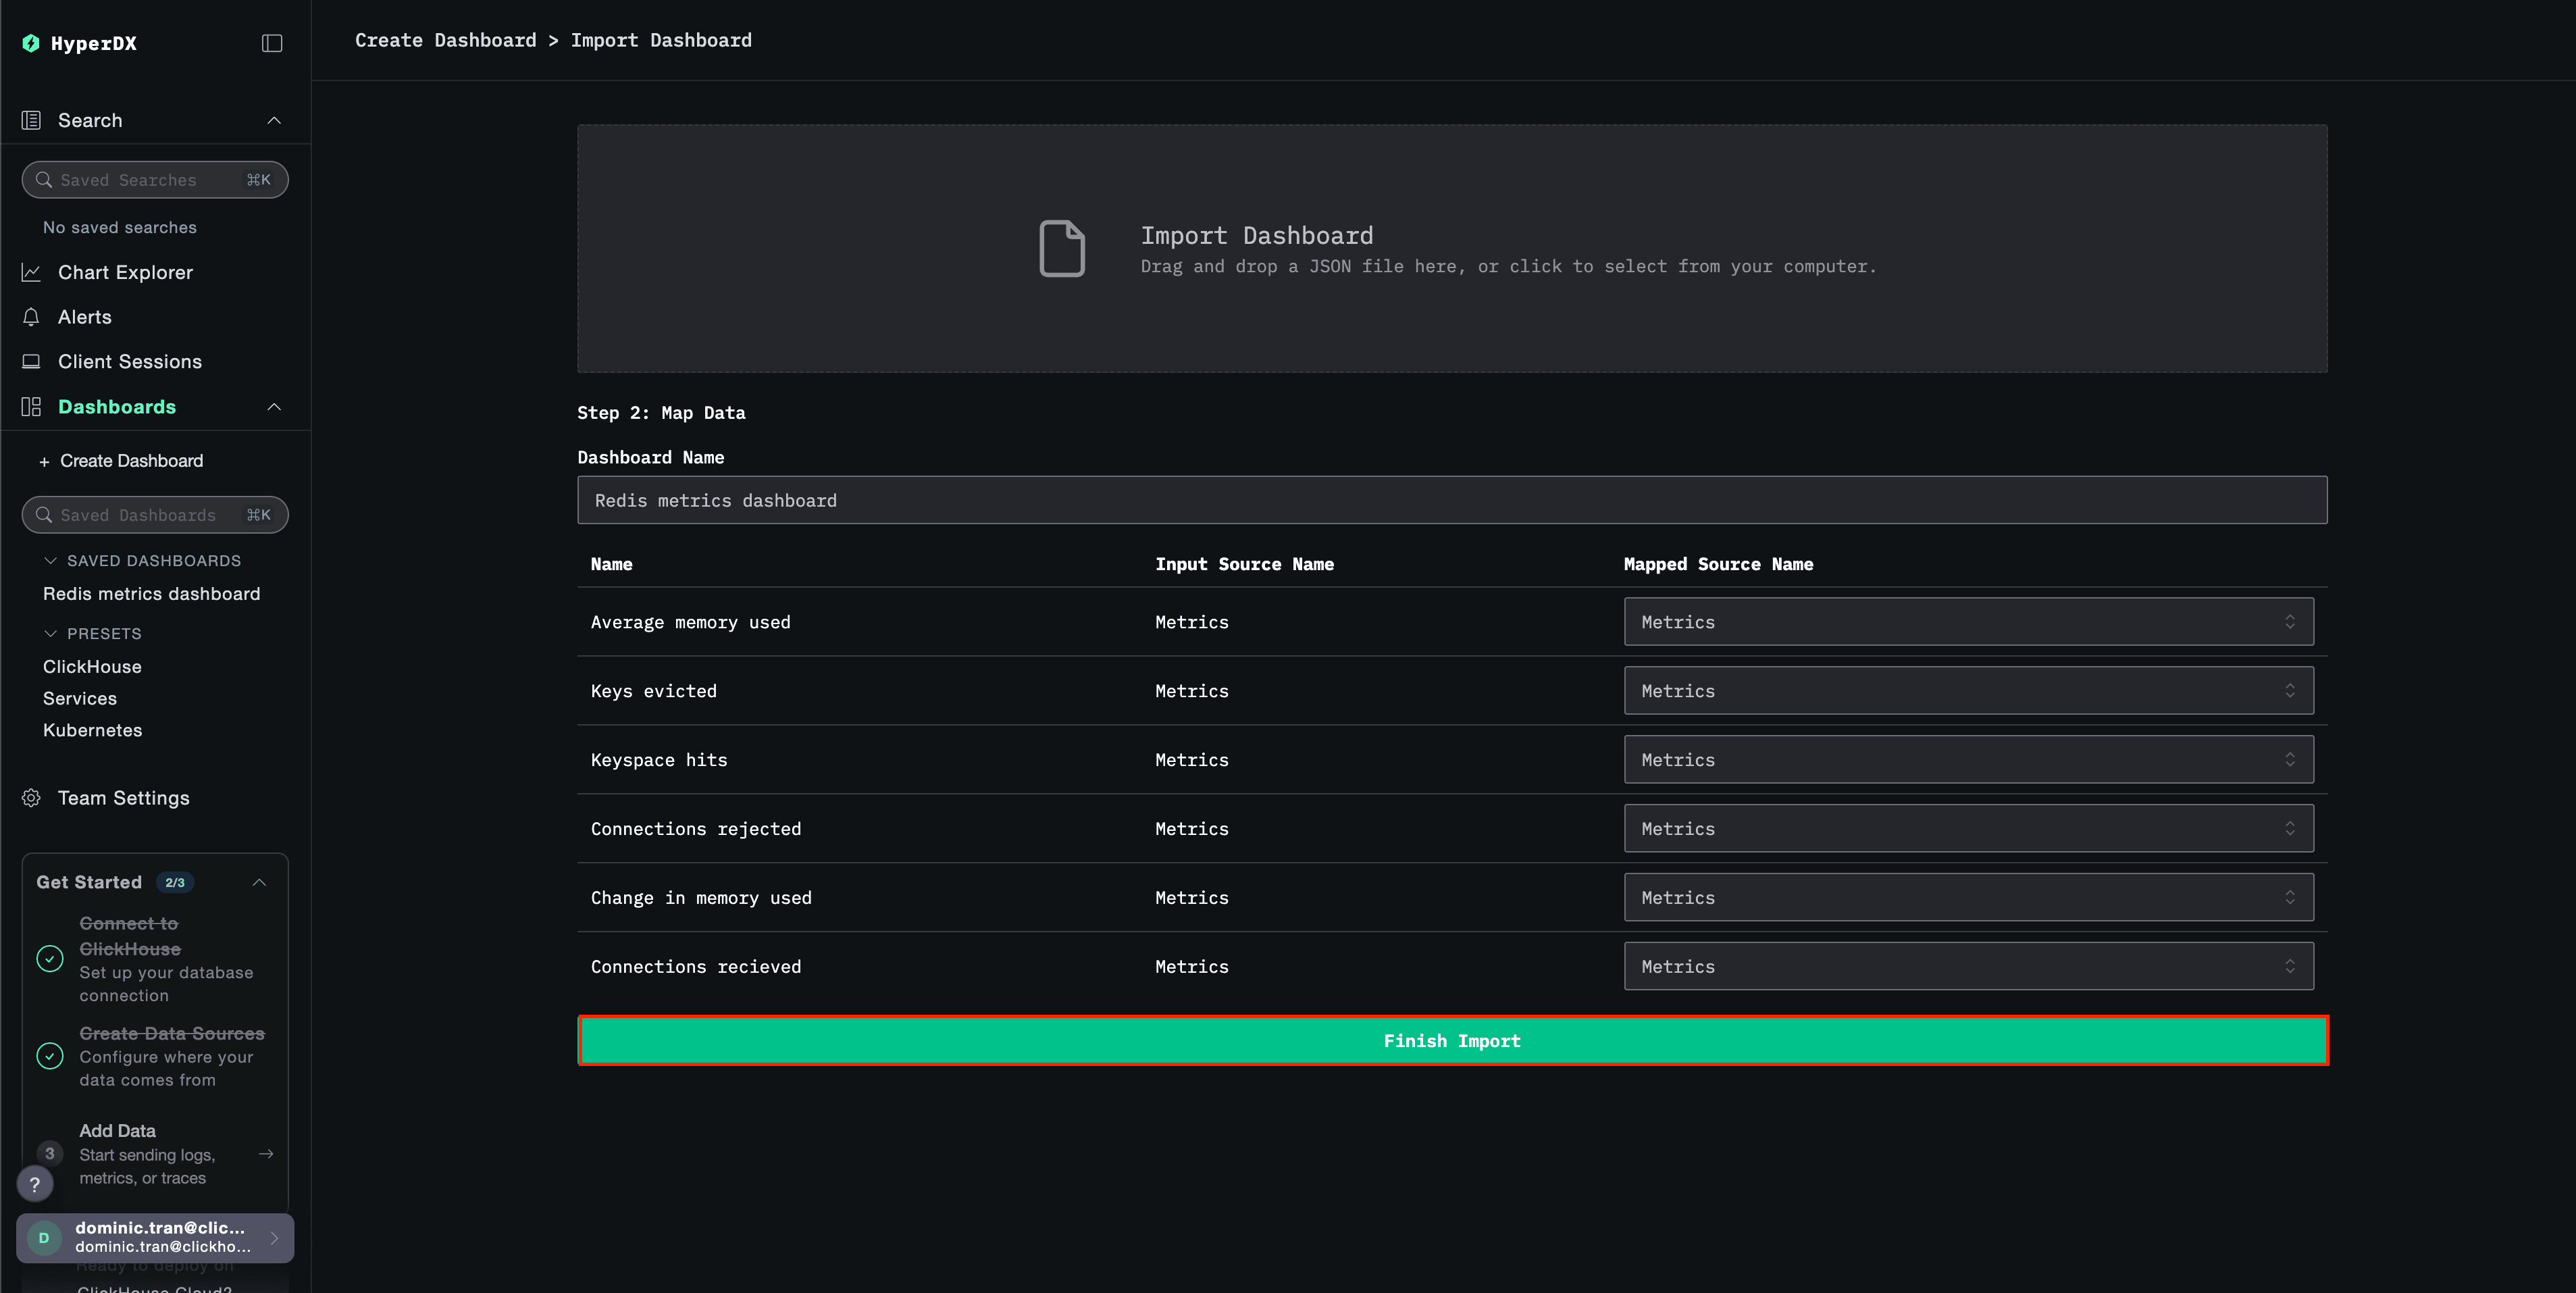
- Open HyperDX and navigate to the Dashboards section
- Click Import Dashboard in the upper right corner under the ellipses

- Upload the
redis-metrics-dashboard.jsonfile and click Finish Import
View the dashboard
The dashboard will be created with all visualizations pre-configured:
Troubleshooting
Custom config not loading
Verify the environment variable CUSTOM_OTELCOL_CONFIG_FILE is set correctly:
docker exec <container-name> printenv CUSTOM_OTELCOL_CONFIG_FILECheck that the custom config file is mounted at /etc/otelcol-contrib/custom.config.yaml:
docker exec <container-name> ls -lh /etc/otelcol-contrib/custom.config.yamlView the custom config content to verify it’s readable:
docker exec <container-name> cat /etc/otelcol-contrib/custom.config.yamlNo metrics appearing in HyperDX
Verify Redis is accessible from the collector:
# From the ClickStack container
docker exec <clickstack-container> redis-cli -h <redis-host> ping
# Expected output: PONG
Check if the Redis INFO command works:
docker exec <clickstack-container> redis-cli -h <redis-host> INFO stats
# Should display Redis statistics
Verify the effective config includes your Redis receiver:
docker exec <container> cat /etc/otel/supervisor-data/effective.yaml | grep -A 10 "redis:"Check for errors in the collector logs:
docker exec <container> cat /etc/otel/supervisor-data/agent.log | grep -i redis
# Look for connection errors or authentication failures
Authentication errors
If you see authentication errors in the logs:
# Verify Redis requires authentication
redis-cli CONFIG GET requirepass

# Test authentication
redis-cli -a <password> ping

# Ensure password is set in ClickStack environment
docker exec <clickstack-container> printenv REDIS_PASSWORD
Update your configuration to use the password:
receivers:
  redis:
    endpoint: "redis:6379"
    password: ${env:REDIS_PASSWORD}
Network connectivity issues
If ClickStack can’t reach Redis:
# Check if both containers are on the same network
docker network inspect <network-name>

# Test connectivity
docker exec <clickstack-container> ping redis
docker exec <clickstack-container> telnet redis 6379
Ensure your Docker Compose file or docker run commands place both containers on the same network.
Next steps
- Set up alerts for critical metrics (memory usage thresholds, connection limits, cache hit rate drops)
- Create additional dashboards for specific use cases (replication lag, persistence performance)
- Monitor multiple Redis instances by duplicating the receiver configuration with different endpoints and service names
Going to production
This guide extends ClickStack’s built-in OpenTelemetry Collector for quick setup. For production deployments, we recommend running your own OTel Collector and sending data to ClickStack’s OTLP endpoint. See Sending OpenTelemetry data for production configuration.