

 Set up docs MCP
Integration with existing MySQL
This section covers configuring your existing MySQL installation to send logs to ClickStack by modifying the ClickStack OTel collector configuration.
If you would like to test the MySQL logs integration before configuring your own existing setup, you can test with our preconfigured setup and sample data in the “Demo dataset” section.
Prerequisites
- ClickStack instance running
- Existing MySQL installation (version 5.7 or newer)
- Access to modify MySQL configuration files
- Sufficient disk space for log files
Configure MySQL logging
MySQL supports multiple log types. For comprehensive monitoring with OpenTelemetry, we recommend enabling the error log and slow query log.
The my.cnf or my.ini configuration file is typically located at:
- Linux (apt/yum):
/etc/mysql/my.cnfor/etc/my.cnf - macOS (Homebrew):
/usr/local/etc/my.cnfor/opt/homebrew/etc/my.cnf - Docker: Configuration is usually set via environment variables or mounted config file
Add or modify these settings in the [mysqld] section:
[mysqld]
# Error log configuration
log_error = /var/log/mysql/error.log

# Slow query log configuration
slow_query_log = ON
slow_query_log_file = /var/log/mysql/mysql-slow.log
long_query_time = 1
log_queries_not_using_indexes = ON

# Optional: General query log (verbose, use with caution in production)
# general_log = ON
# general_log_file = /var/log/mysql/mysql-general.logAfter making these changes, restart MySQL:
# For systemd
sudo systemctl restart mysql

# For Docker
docker restart <mysql-container>
Verify logs are being written:
# Check error log
tail -f /var/log/mysql/error.log

# Check slow query log
tail -f /var/log/mysql/mysql-slow.log
Create custom OTel collector configuration
ClickStack allows you to extend the base OpenTelemetry Collector configuration by mounting a custom configuration file and setting an environment variable. The custom configuration is merged with the base configuration managed by HyperDX via OpAMP.
Create a file named mysql-logs-monitoring.yaml with the following configuration:
receivers:
  filelog/mysql_error:
    include:
      - /var/log/mysql/error.log
    start_at: end
    multiline:
      line_start_pattern: '^\d{4}-\d{2}-\d{2}T\d{2}:\d{2}:\d{2}'
    operators:
      - type: regex_parser
        parse_from: body
        parse_to: attributes
        regex: '^(?P<timestamp>\d{4}-\d{2}-\d{2}T\d{2}:\d{2}:\d{2}\.\d{6}[+-]\d{2}:\d{2})\s+(?P<thread_id>\d+)\s+\[(?P<level>[^\]]+)\]\s+(\[(?P<error_code>[^\]]+)\]\s+)?(?P<message>.*)$'

      - type: time_parser
        parse_from: attributes.timestamp
        layout_type: gotime
        layout: '2006-01-02T15:04:05.999999-07:00'
        parse_to: body

      - type: add
        field: attributes.source
        value: "mysql-error"

      - type: add
        field: resource["service.name"]
        value: "mysql-production"

  filelog/mysql_slow:
    include:
      - /var/log/mysql/mysql-slow.log
    start_at: end
    multiline:
      line_start_pattern: '^# Time:'
    operators:
      - type: regex_parser
        parse_from: body
        parse_to: attributes
        regex: '^# Time: (?P<timestamp>\d{4}-\d{2}-\d{2}T\d{2}:\d{2}:\d{2}\.\d+Z)\n# User@Host: (?P<user>[^\[]+)\[(?P<user_host>[^\]]*)\]\s+@\s+(?P<host>[^\[]*)\[(?P<ip>[^\]]*)\].*\n# Query_time: (?P<query_time>[\d.]+)\s+Lock_time: (?P<lock_time>[\d.]+)\s+Rows_sent: (?P<rows_sent>\d+)\s+Rows_examined: (?P<rows_examined>\d+)'

      - type: time_parser
        parse_from: attributes.timestamp
        layout_type: gotime
        layout: '2006-01-02T15:04:05.999999Z'
        parse_to: body

      - type: add
        field: attributes.source
        value: "mysql-slow"

      - type: add
        field: resource["service.name"]
        value: "mysql-production"

service:
  pipelines:
    logs/mysql:
      receivers: [filelog/mysql_error, filelog/mysql_slow]
      processors:
        - memory_limiter
        - transform
        - batch
      exporters:
        - clickhouse
This configuration:
- Reads MySQL error logs and slow query logs from their standard locations
- Handles multi-line log entries (slow queries span multiple lines)
- Parses both log formats to extract structured fields (level, error_code, query_time, rows_examined)
- Preserves original log timestamps
- Adds
source: mysql-errorandsource: mysql-slowattributes for filtering in HyperDX - Routes logs to the ClickHouse exporter via a dedicated pipeline
Configure ClickStack to load custom configuration
To enable custom collector configuration in your existing ClickStack deployment, mount the custom config file at /etc/otelcol-contrib/custom.config.yaml and set the environment variable CUSTOM_OTELCOL_CONFIG_FILE=/etc/otelcol-contrib/custom.config.yaml.
Update your ClickStack deployment configuration:
services:
  clickstack:
    # ... existing configuration ...
    environment:
      - CUSTOM_OTELCOL_CONFIG_FILE=/etc/otelcol-contrib/custom.config.yaml
      # ... other environment variables ...
    volumes:
      - ./mysql-logs-monitoring.yaml:/etc/otelcol-contrib/custom.config.yaml:ro
      - /var/log/mysql:/var/log/mysql:ro
# ... other volumes ...Verifying Logs in HyperDX
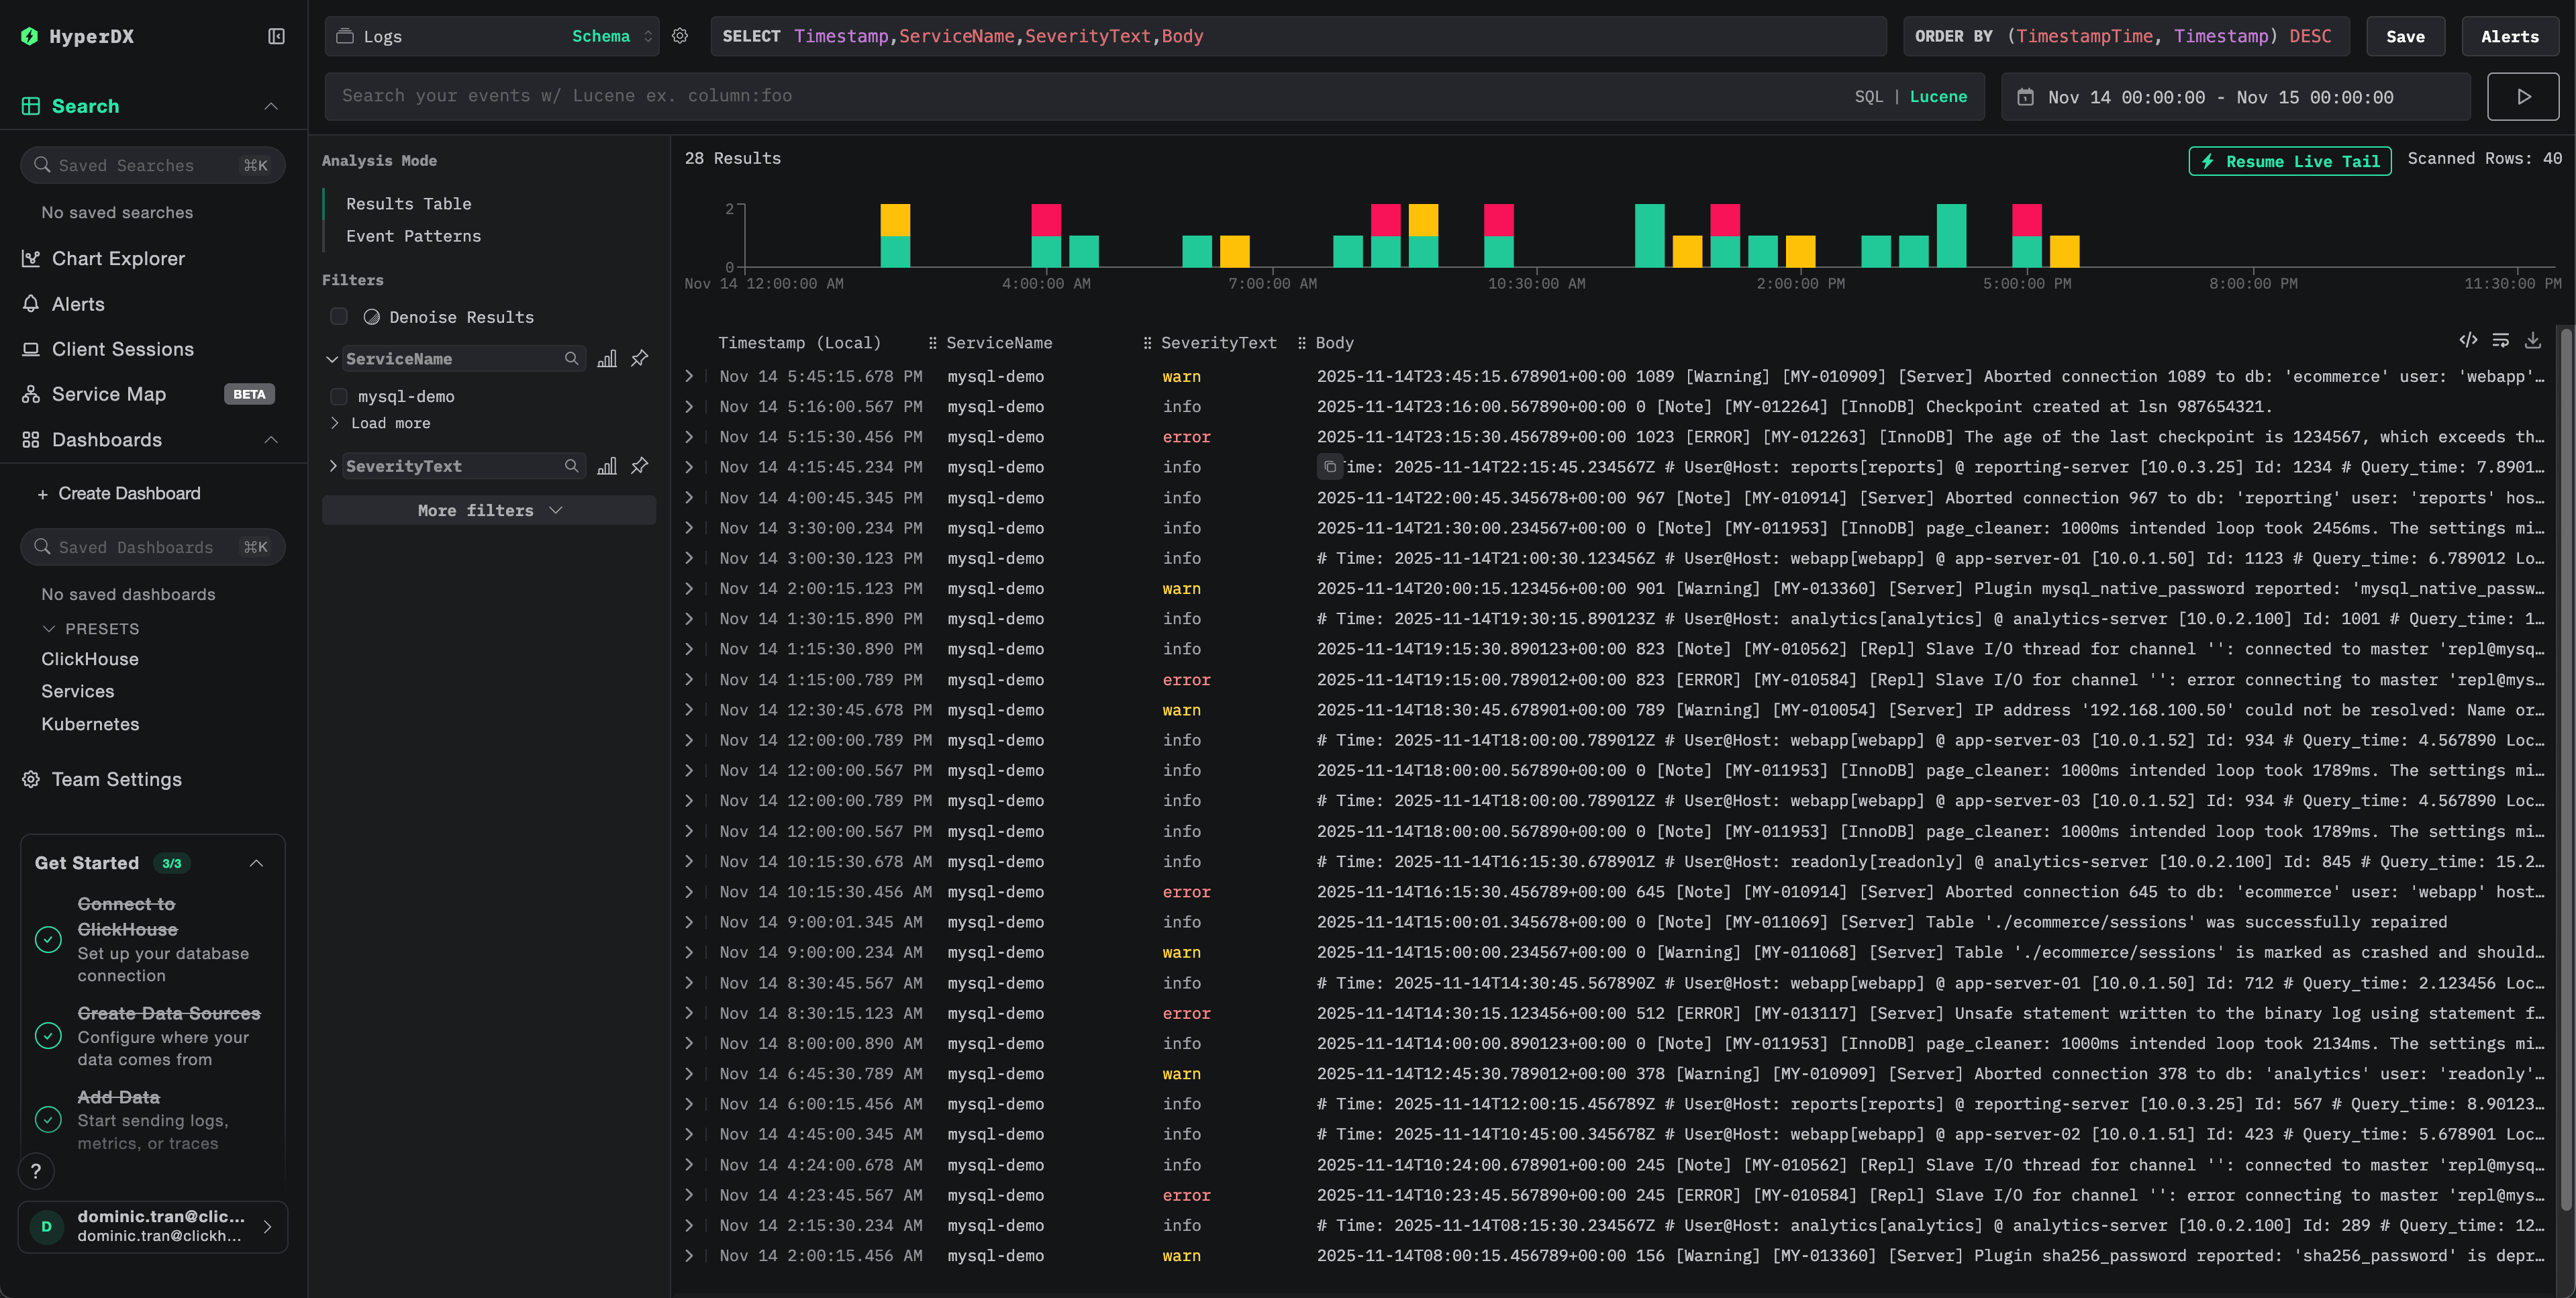
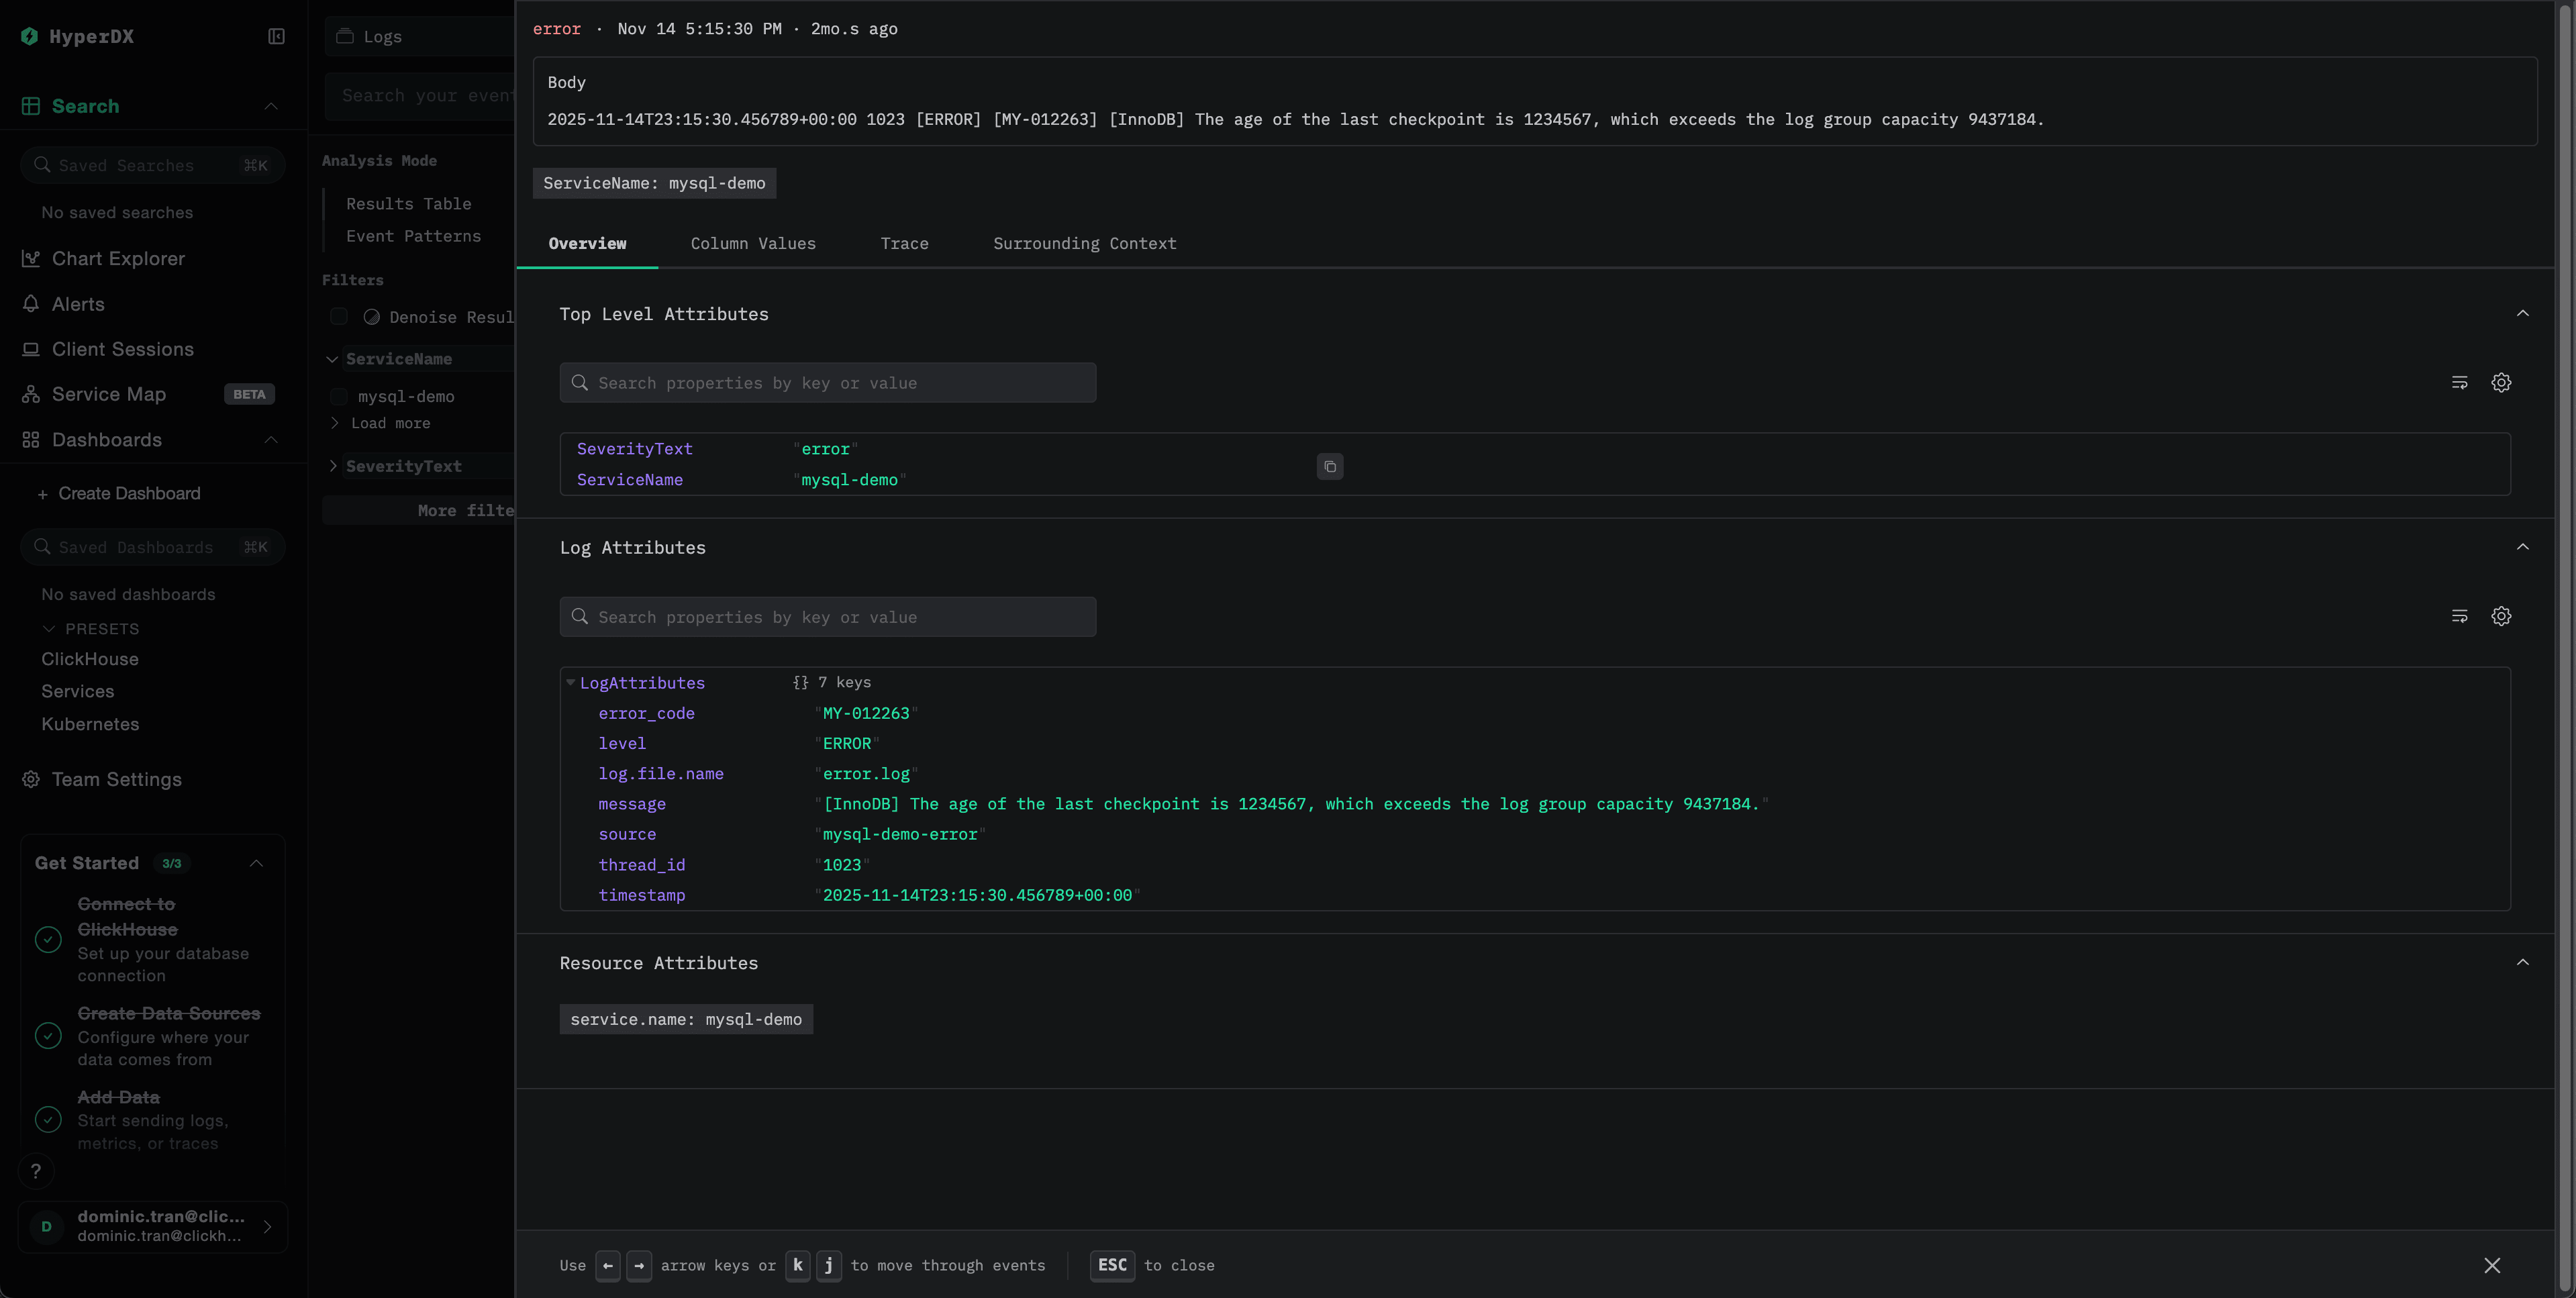
Once configured, log into HyperDX and verify logs are flowing:
- Navigate to the search view
- Set source to Logs
- Filter by
source:mysql-errororsource:mysql-slowto see MySQL-specific logs - You should see structured log entries with fields like
level,error_code,message(for error logs) andquery_time,rows_examined,query(for slow query logs)
Demo dataset
For users who want to test the MySQL logs integration before configuring their production systems, we provide a sample dataset of pre-generated MySQL logs with realistic patterns.
Download the sample dataset
Download the sample log files:
# Download error log
curl -O https://datasets-documentation.s3.eu-west-3.amazonaws.com/clickstack-integrations/mysql/error.log

# Download slow query log
curl -O https://datasets-documentation.s3.eu-west-3.amazonaws.com/clickstack-integrations/mysql/mysql-slow.log
The dataset includes:
- Error log entries (startup messages, warnings, connection errors, InnoDB messages)
- Slow queries with realistic performance characteristics
- Connection lifecycle events
- Database server startup and shutdown sequences
Create test collector configuration
Create a file named mysql-logs-demo.yaml with the following configuration:
cat > mysql-logs-demo.yaml << 'EOF'
receivers:
  filelog/mysql_error:
    include:
      - /tmp/mysql-demo/error.log
    start_at: beginning  # Read from beginning for demo data
    multiline:
      line_start_pattern: '^\d{4}-\d{2}-\d{2}T\d{2}:\d{2}:\d{2}'
    operators:
      - type: regex_parser
        parse_from: body
        parse_to: attributes
        regex: '^(?P<timestamp>\d{4}-\d{2}-\d{2}T\d{2}:\d{2}:\d{2}\.\d{6}[+-]\d{2}:\d{2})\s+(?P<thread_id>\d+)\s+\[(?P<level>[^\]]+)\]\s+(\[(?P<error_code>[^\]]+)\]\s+)?(?P<message>.*)$'
      - type: time_parser
        parse_from: attributes.timestamp
        layout_type: gotime
        layout: '2006-01-02T15:04:05.999999-07:00'
        parse_to: body
      - type: add
        field: attributes.source
        value: "mysql-demo-error"
      - type: add
        field: resource["service.name"]
        value: "mysql-demo"

  filelog/mysql_slow:
    include:
      - /tmp/mysql-demo/mysql-slow.log
    start_at: beginning  # Read from beginning for demo data
    multiline:
      line_start_pattern: '^# Time:'
    operators:
      - type: regex_parser
        parse_from: body
        parse_to: attributes
        regex: '^# Time: (?P<timestamp>\d{4}-\d{2}-\d{2}T\d{2}:\d{2}:\d{2}\.\d+Z)\n# User@Host: (?P<user>[^\[]+)\[(?P<user_host>[^\]]*)\]\s+@\s+(?P<host>[^\[]*)\[(?P<ip>[^\]]*)\].*\n# Query_time: (?P<query_time>[\d.]+)\s+Lock_time: (?P<lock_time>[\d.]+)\s+Rows_sent: (?P<rows_sent>\d+)\s+Rows_examined: (?P<rows_examined>\d+)'
      - type: time_parser
        parse_from: attributes.timestamp
        layout_type: gotime
        layout: '2006-01-02T15:04:05.999999Z'
        parse_to: body
      - type: add
        field: attributes.source
        value: "mysql-demo-slow"
      - type: add
        field: resource["service.name"]
        value: "mysql-demo"

service:
  pipelines:
    logs/mysql-demo:
      receivers: [filelog/mysql_error, filelog/mysql_slow]
      processors:
        - memory_limiter
        - transform
        - batch
      exporters:
        - clickhouse
EOF
Run ClickStack with demo configuration
Run ClickStack with the demo logs and configuration:
docker run --name clickstack-demo \
  -p 8080:8080 -p 4317:4317 -p 4318:4318 \
  -e CUSTOM_OTELCOL_CONFIG_FILE=/etc/otelcol-contrib/custom.config.yaml \
  -v "$(pwd)/mysql-logs-demo.yaml:/etc/otelcol-contrib/custom.config.yaml:ro" \
  -v "$(pwd)/error.log:/tmp/mysql-demo/error.log:ro" \
  -v "$(pwd)/mysql-slow.log:/tmp/mysql-demo/mysql-slow.log:ro" \
  clickhouse/clickstack-all-in-one:latest
Verify logs in HyperDX
Once ClickStack is running:
- Wait a few moments for ClickStack to fully initialize (typically 30-60 seconds)
- Open HyperDX and log in to your account (you may need to create an account first)
- Navigate to the Search view and set the source to
Logs - Set the time range to 2025-11-13 00:00:00 - 2025-11-16 00:00:00
- You should see 40 logs total (30 error logs with
source:mysql-demo-error+ 10 slow queries withsource:mysql-demo-slow)
Dashboards and visualization
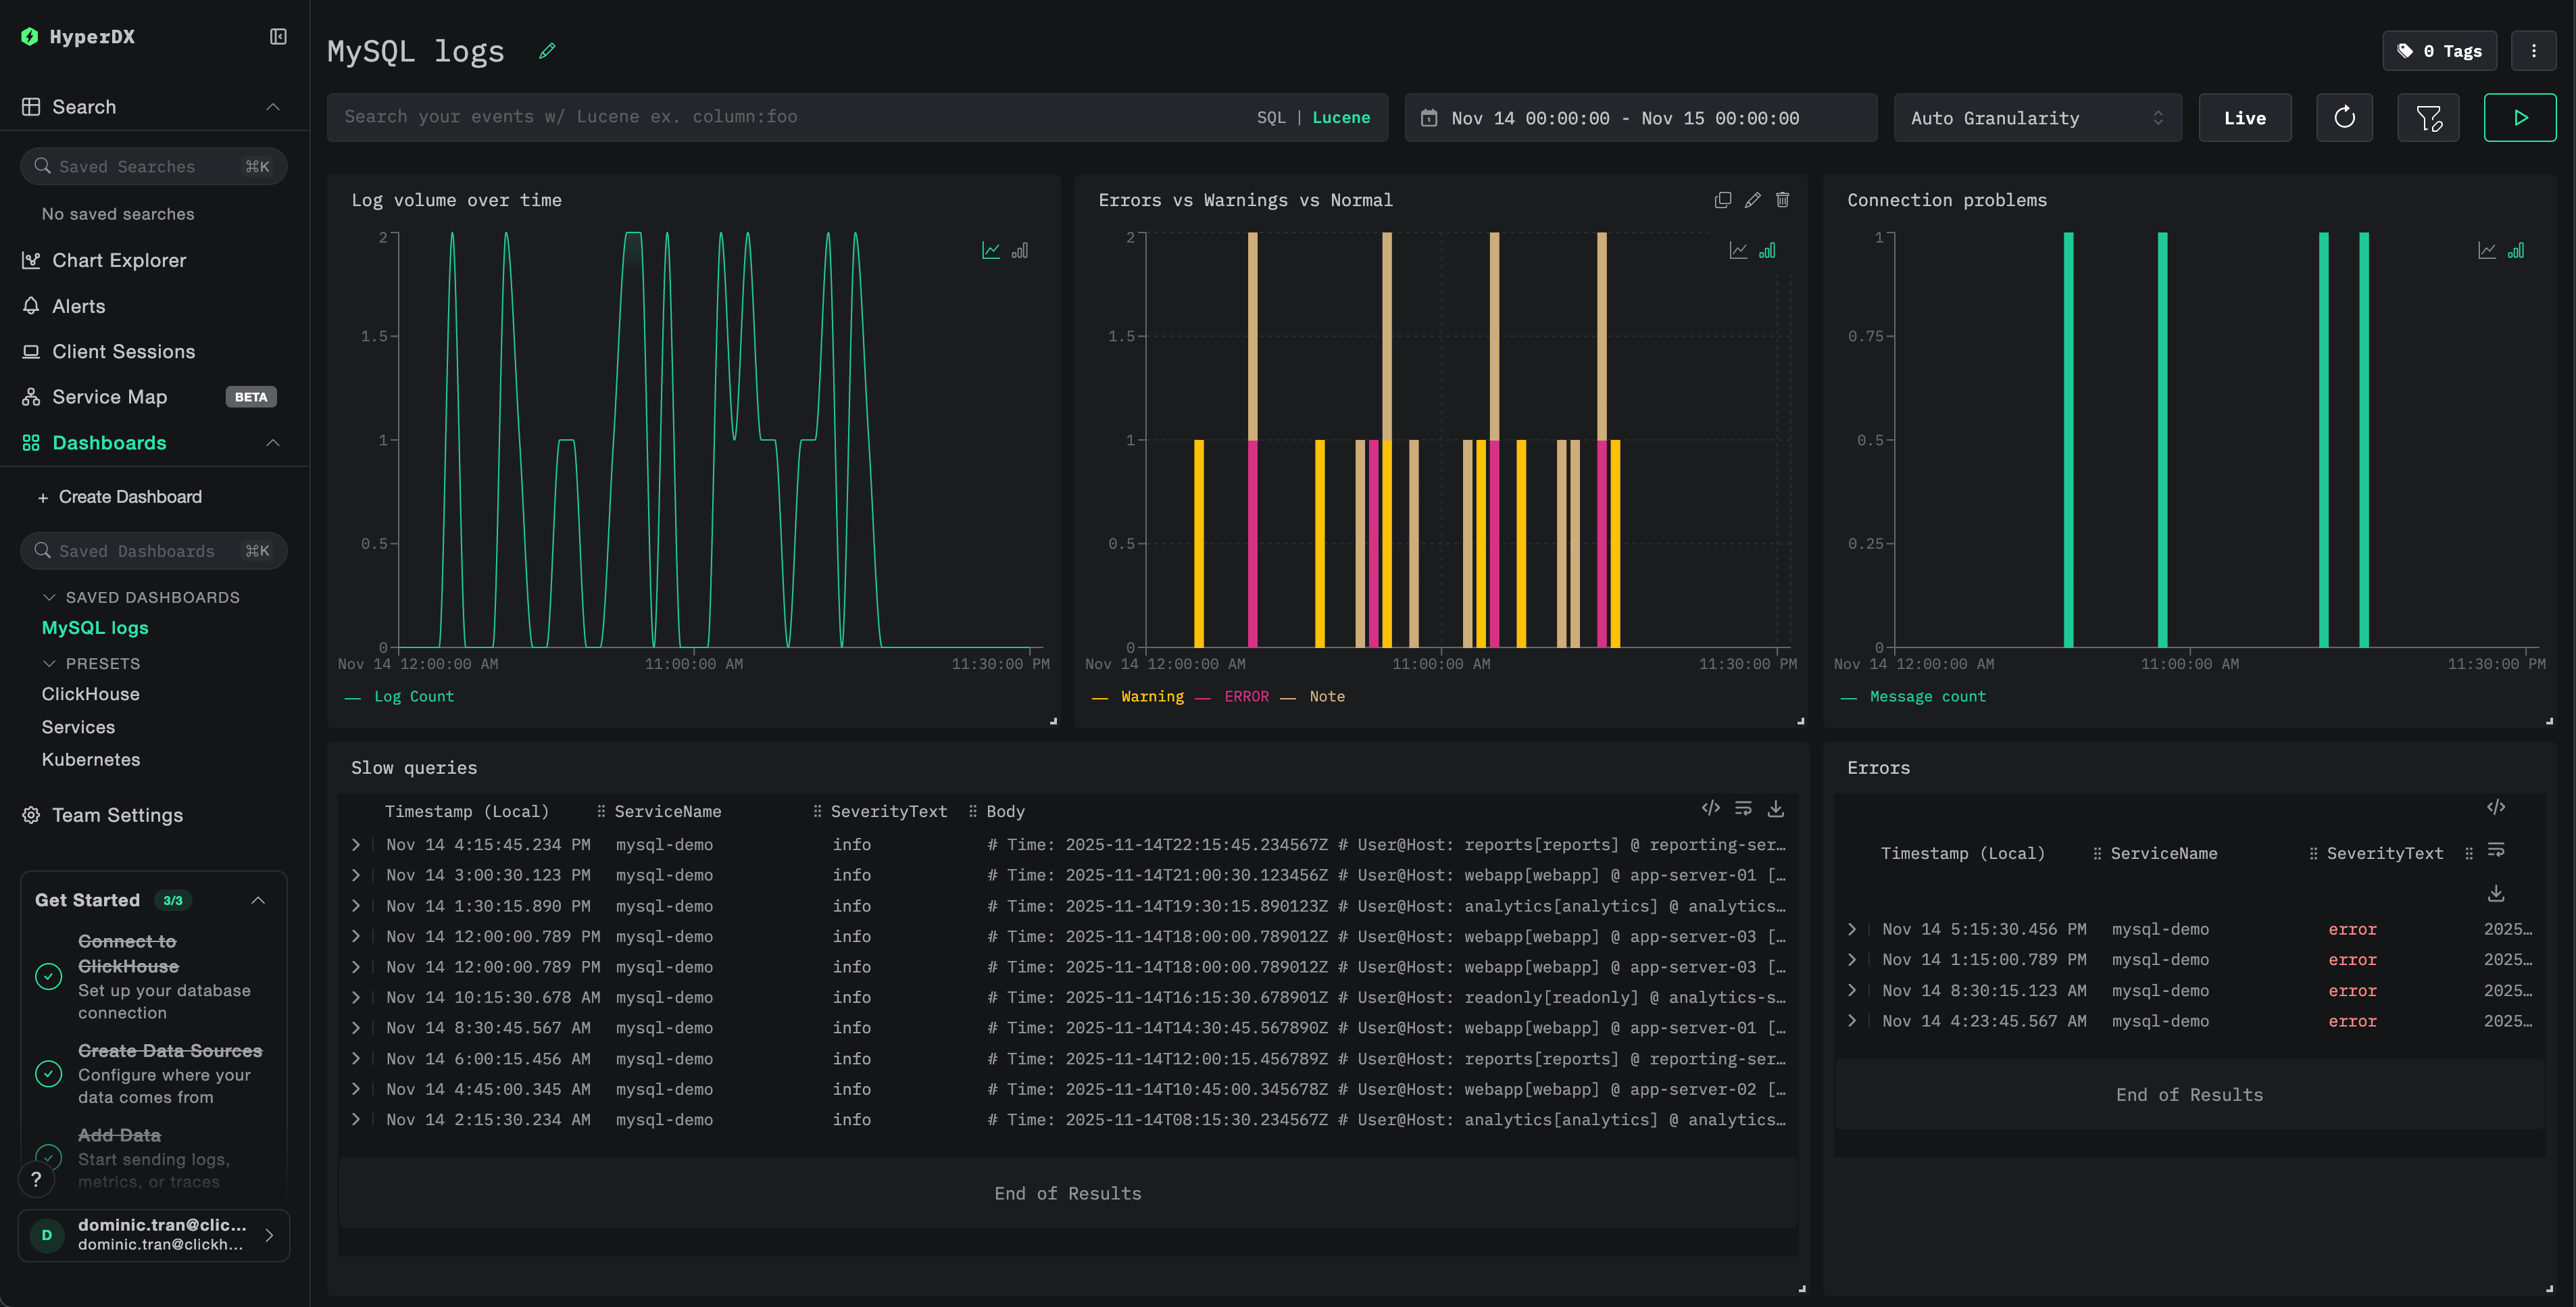
To help you get started monitoring MySQL with ClickStack, we provide essential visualizations for MySQL logs.
Download the dashboard configuration
Import the pre-built dashboard
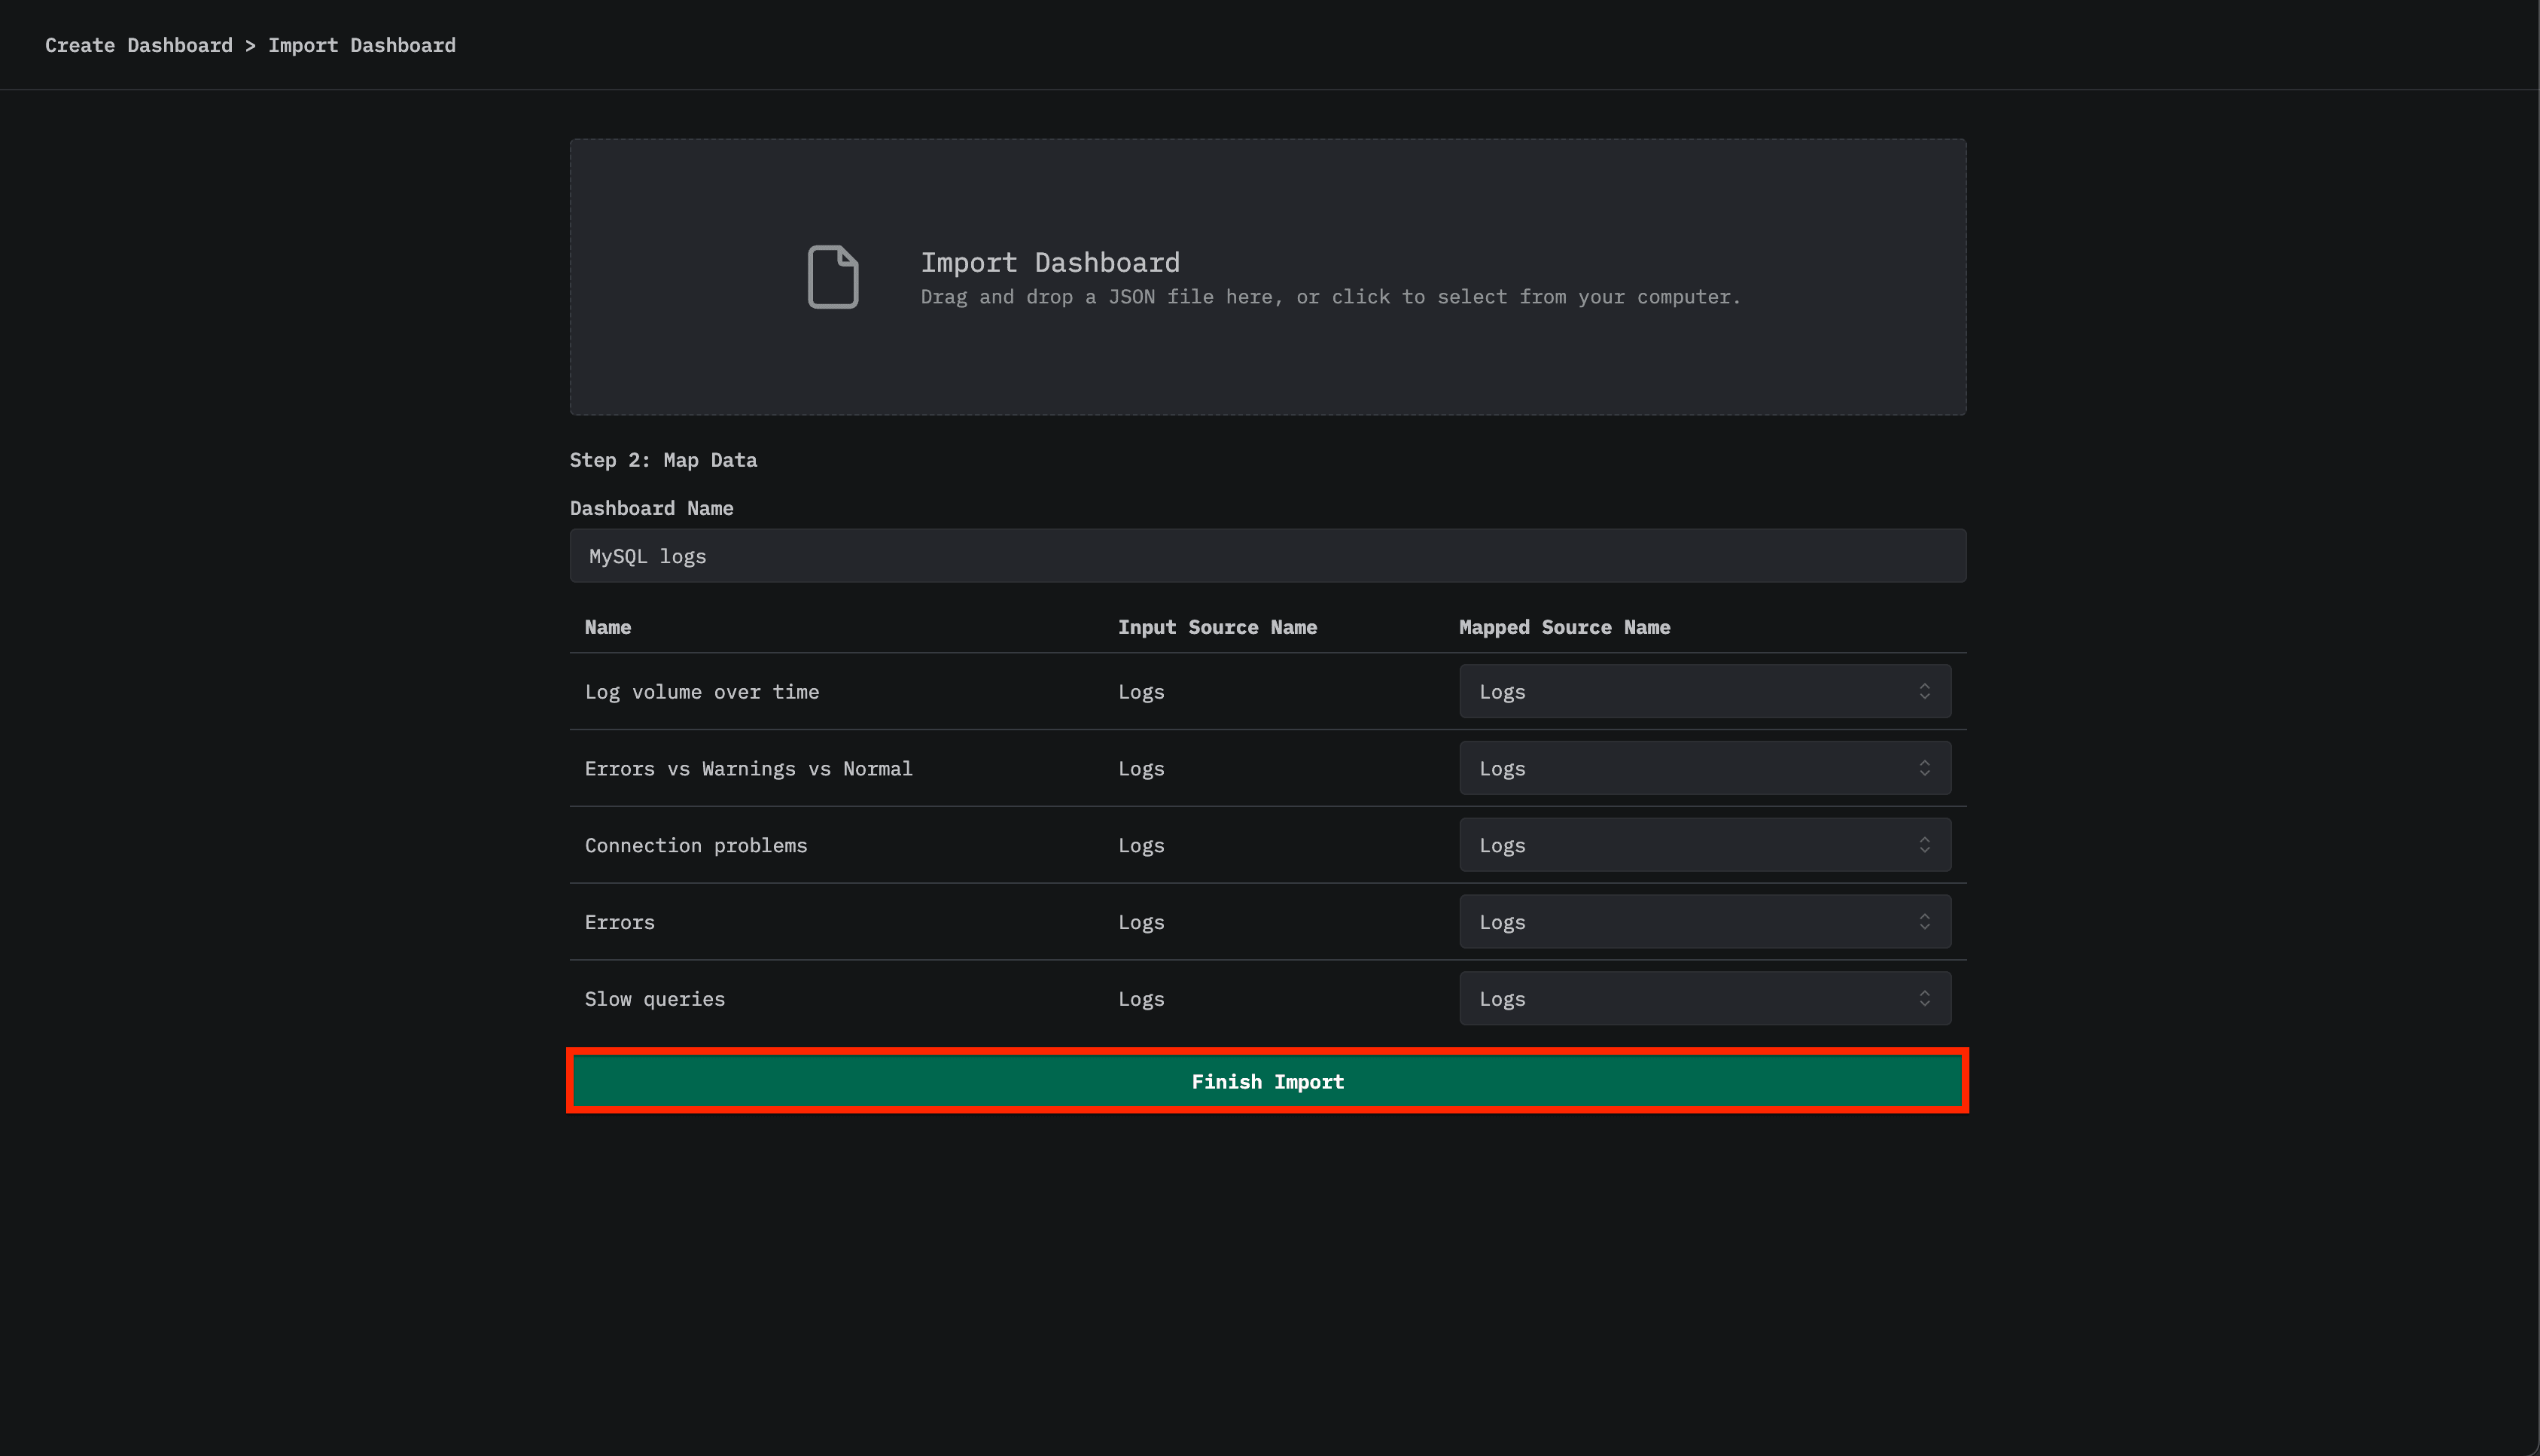
- Open HyperDX and navigate to the Dashboards section
- Click Import Dashboard in the upper right corner under the ellipses

- Upload the
mysql-logs-dashboard.jsonfile and click Finish Import
View the dashboard
The dashboard will be created with all visualizations pre-configured.
Troubleshooting
Custom config not loading
Verify the environment variable is set:
docker exec <container-name> printenv CUSTOM_OTELCOL_CONFIG_FILECheck the custom config file is mounted and readable:
docker exec <container-name> cat /etc/otelcol-contrib/custom.config.yaml | head -10No logs appearing in HyperDX
Check the effective config includes your filelog receiver:
docker exec <container> cat /etc/otel/supervisor-data/effective.yaml | grep -A 10 filelogCheck for errors in the collector logs:
docker exec <container> cat /etc/otel/supervisor-data/agent.log | grep -i mysqlIf using the demo dataset, verify the log files are accessible:
docker exec <container> cat /tmp/mysql-demo/error.log | wc -l
docker exec <container> cat /tmp/mysql-demo/mysql-slow.log | wc -l
Slow query logs not appearing
Verify slow query log is enabled in MySQL:
SHOW VARIABLES LIKE 'slow_query_log';
SHOW VARIABLES LIKE 'long_query_time';
Check if MySQL is writing slow queries:
tail -f /var/log/mysql/mysql-slow.logGenerate a test slow query:
SELECT SLEEP(2);Logs not parsing correctly
Verify your MySQL log format matches the expected format. The regex patterns in this guide are designed for MySQL 5.7+ and 8.0+ default formats.
Check a few lines from your error log:
head -5 /var/log/mysql/error.logExpected format:
2025-11-14T10:23:45.123456+00:00 0 [System] [MY-010116] [Server] /usr/sbin/mysqld (mysqld 8.0.35) starting as process 1If your format differs significantly, adjust the regex patterns in the configuration.
Next steps
- Set up alerts for critical events (connection failures, slow queries exceeding thresholds, error spikes)
- Create custom dashboards for slow query analysis by query pattern
- Tune
long_query_timebased on observed query performance patterns
Going to production
This guide extends ClickStack’s built-in OpenTelemetry Collector for quick setup. For production deployments, we recommend running your own OTel Collector and sending data to ClickStack’s OTLP endpoint. See Sending OpenTelemetry data for production configuration.