

 Set up docs MCP
Integration with existing hosts
This section covers configuring your existing hosts to send system logs to ClickStack by modifying the ClickStack OTel collector configuration to read all system log files (syslog, auth, kernel, daemon, and application logs).
If you would like to test the host logs integration before configuring your own existing setup, you can test with our preconfigured setup and sample data in the “Demo dataset” section.
Prerequisites
- ClickStack instance running
- System with syslog files
- Access to modify ClickStack configuration files
Verify syslog files exist
First, verify that your system is writing syslog files:
# Check if syslog files exist (Linux)
ls -la /var/log/syslog /var/log/messages

# Or on macOS
ls -la /var/log/system.log

# View recent entries
tail -20 /var/log/syslog
Common syslog locations:
- Ubuntu/Debian:
/var/log/syslog - RHEL/CentOS/Fedora:
/var/log/messages - macOS:
/var/log/system.log
Create custom OTel collector configuration
ClickStack allows you to extend the base OpenTelemetry Collector configuration by mounting a custom configuration file and setting an environment variable.
Create a file named host-logs-monitoring.yaml with the configuration for your system:
receivers:
  filelog/syslog:
    include:
      - /var/log/syslog
      - /var/log/**/*.log
    start_at: end
    operators:
      - type: regex_parser
        regex: '^(?P<timestamp>\S+) (?P<hostname>\S+) (?P<unit>\S+?)(?:\[(?P<pid>\d+)\])?: (?P<message>.*)$'
        parse_from: body
        parse_to: attributes

      - type: time_parser
        parse_from: attributes.timestamp
        layout_type: gotime
        layout: '2006-01-02T15:04:05.999999-07:00'

      - type: add
        field: attributes.source
        value: "host-logs"

      - type: add
        field: resource["service.name"]
        value: "host-production"

service:
  pipelines:
    logs/host:
      receivers: [filelog/syslog]
      processors:
        - memory_limiter
        - transform
        - batch
      exporters:
- clickhousereceivers:
filelog/syslog:
include:
- /var/log/syslog
- /var/log/messages
- /var/log/**/*.log
start_at: end
operators:
- type: regex_parser
regex: '^(?P<timestamp>\w+ \d+ \d{2}:\d{2}:\d{2}) (?P<hostname>\S+) (?P<unit>\S+?)(?:\[(?P<pid>\d+)\])?: (?P<message>.*)$'
parse_from: body
parse_to: attributes
- type: time_parser
parse_from: attributes.timestamp
layout: '%b %d %H:%M:%S'
- type: add
field: attributes.source
value: "host-logs"
- type: add
field: resource["service.name"]
value: "host-production"
service:
pipelines:
logs/host:
receivers: [filelog/syslog]
processors:
- memory_limiter
- transform
- batch
exporters:
- clickhousereceivers:
filelog/syslog:
include:
- /var/log/system.log
- /host/private/var/log/*.log
start_at: end
operators:
- type: regex_parser
regex: '^(?P<timestamp>\w+ \d+ \d{2}:\d{2}:\d{2}) (?P<hostname>\S+) (?P<unit>\S+?)(?:\[(?P<pid>\d+)\])?: (?P<message>.*)$'
parse_from: body
parse_to: attributes
- type: time_parser
parse_from: attributes.timestamp
layout: '%b %d %H:%M:%S'
- type: add
field: attributes.source
value: "host-logs"
- type: add
field: resource["service.name"]
value: "host-production"
service:
pipelines:
logs/host:
receivers: [filelog/syslog]
processors:
- memory_limiter
- transform
- batch
exporters:
- clickhouseAll configurations:
- Read syslog files from their standard locations
- Parse the syslog format to extract structured fields (timestamp, hostname, unit/service, PID, message)
- Preserve original log timestamps
- Add
source: host-logsattribute for filtering in HyperDX - Route logs to the ClickHouse exporter via a dedicated pipeline
Configure ClickStack to load custom configuration
To enable custom collector configuration in your existing ClickStack deployment, you must:
- Mount the custom config file at
/etc/otelcol-contrib/custom.config.yaml - Set the environment variable
CUSTOM_OTELCOL_CONFIG_FILE=/etc/otelcol-contrib/custom.config.yaml - Mount your syslog directory so the collector can read them
Option 1: Docker Compose
Update your ClickStack deployment configuration:
services:
  clickstack:
    # ... existing configuration ...
    environment:
      - CUSTOM_OTELCOL_CONFIG_FILE=/etc/otelcol-contrib/custom.config.yaml
      # ... other environment variables ...
    volumes:
      - ./host-logs-monitoring.yaml:/etc/otelcol-contrib/custom.config.yaml:ro
      - /var/log:/var/log:ro
      # ... other volumes ...
Option 2: Docker Run (All-in-One Image)
If you’re using the all-in-one image with docker run:
docker run --name clickstack \
  -p 8080:8080 -p 4317:4317 -p 4318:4318 \
  -e CUSTOM_OTELCOL_CONFIG_FILE=/etc/otelcol-contrib/custom.config.yaml \
  -v "$(pwd)/host-logs-monitoring.yaml:/etc/otelcol-contrib/custom.config.yaml:ro" \
  -v /var/log:/var/log:ro \
clickhouse/clickstack-all-in-one:latestVerifying Logs in HyperDX
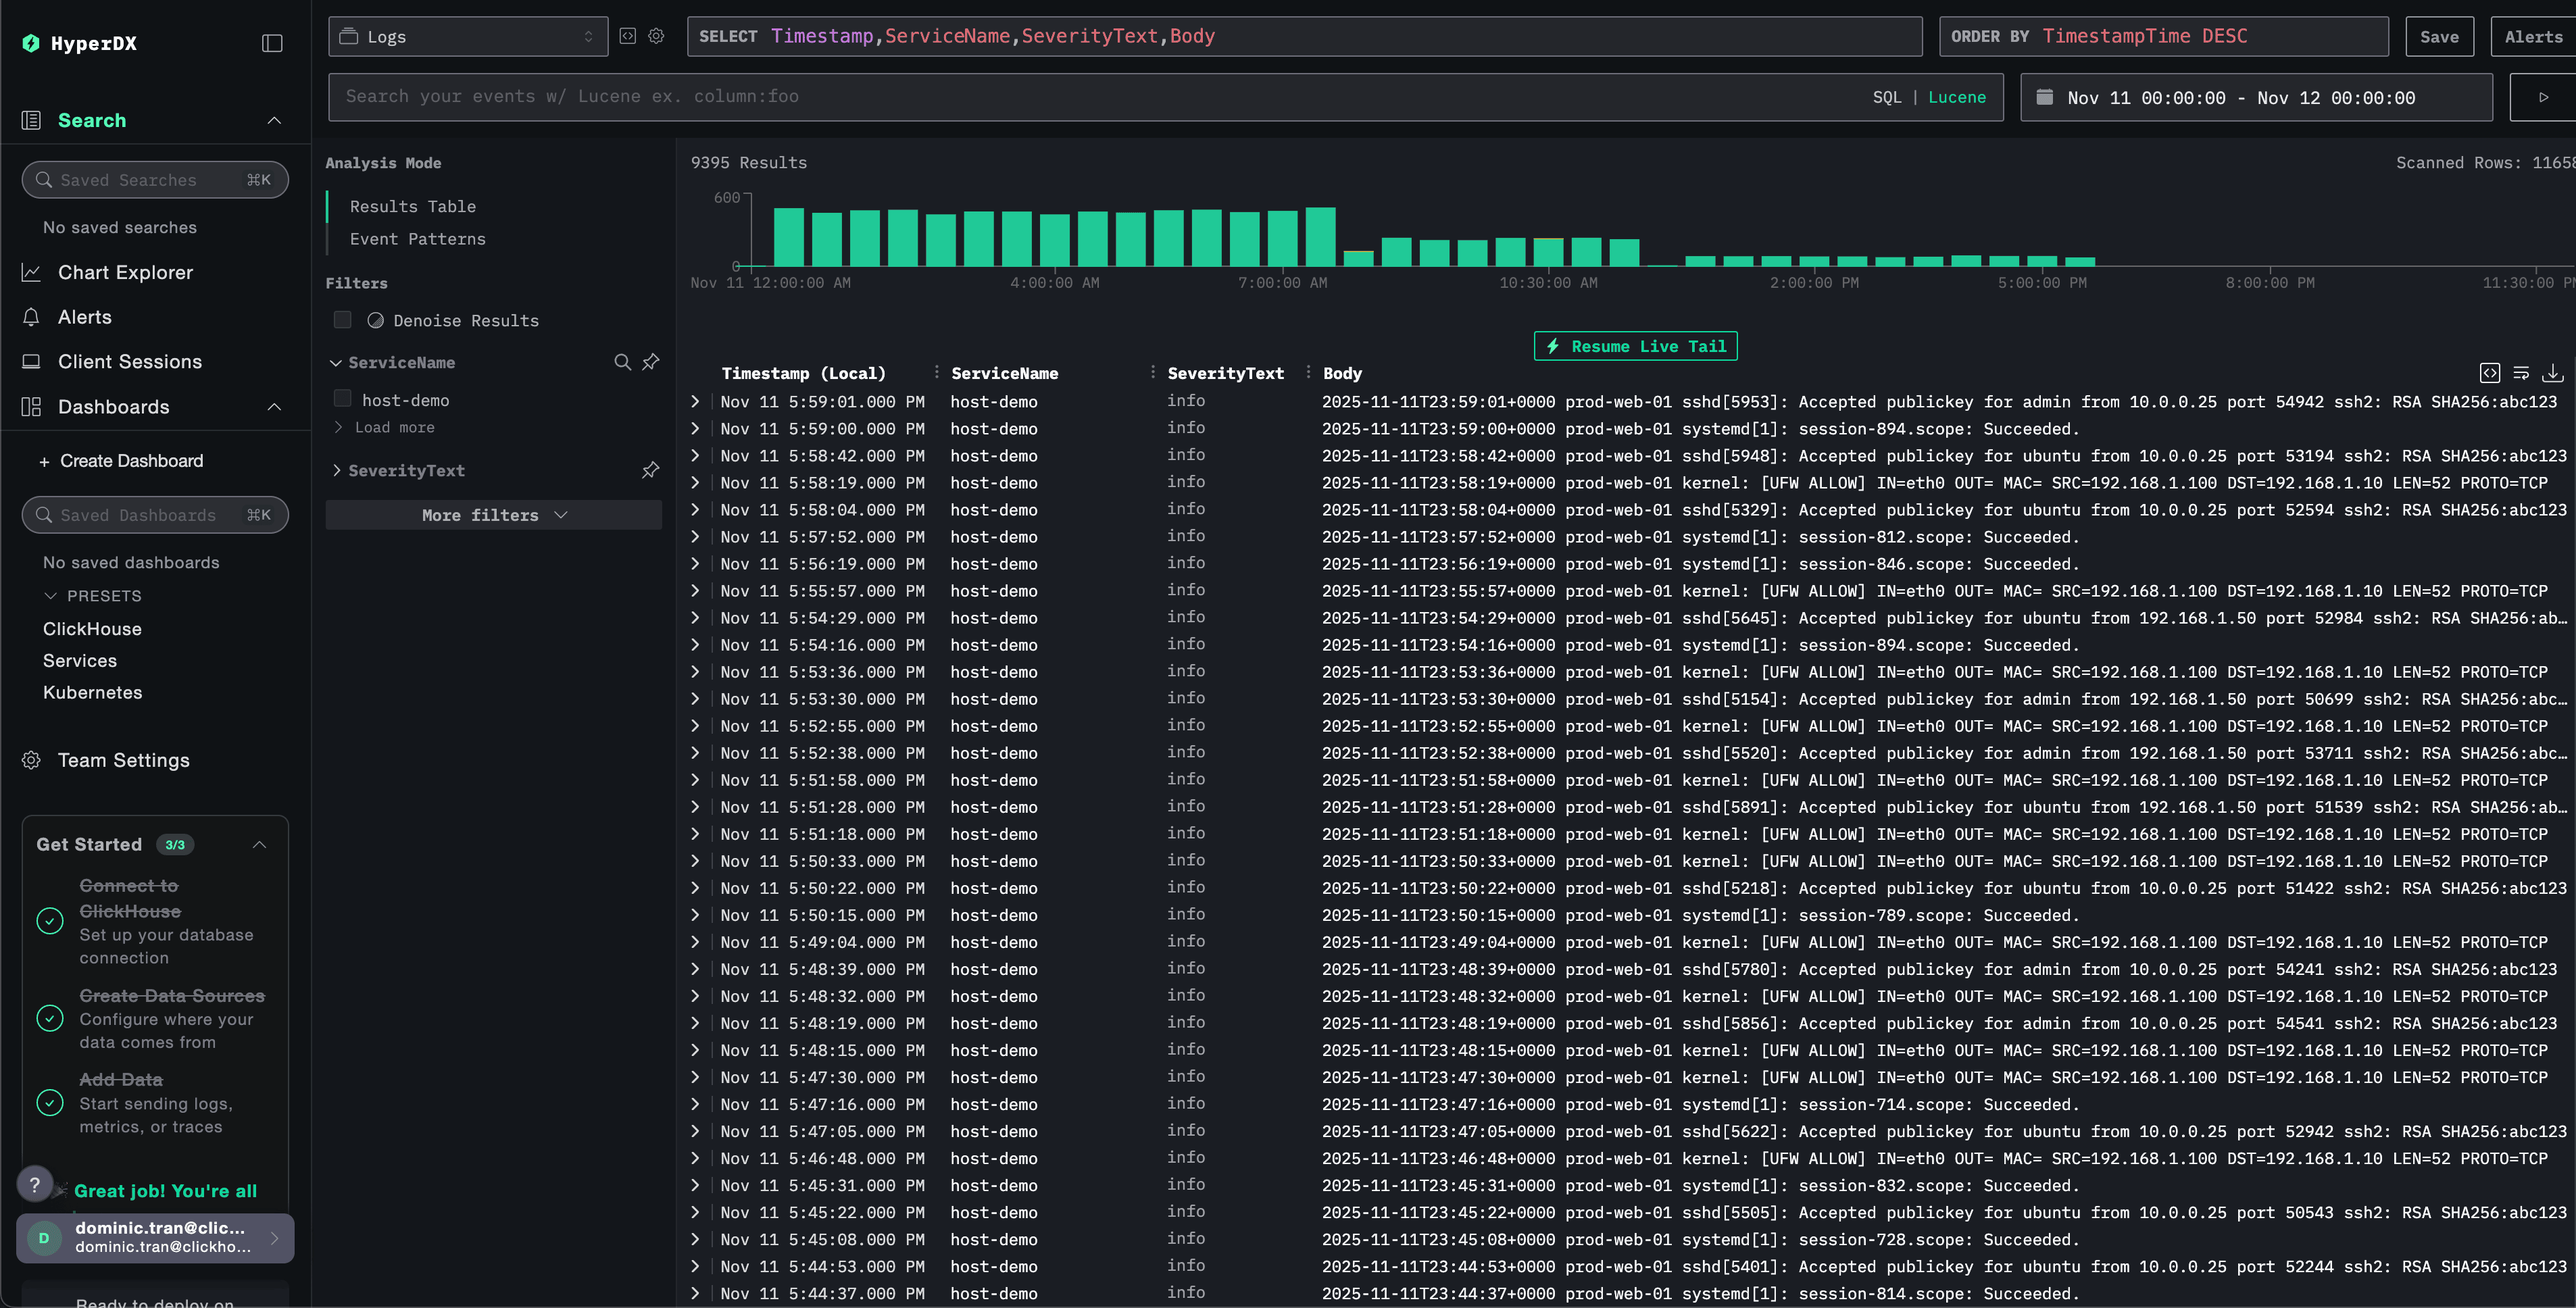
Once configured, log into HyperDX and verify logs are flowing:
- Navigate to the search view
- Set source to Logs
- Filter by
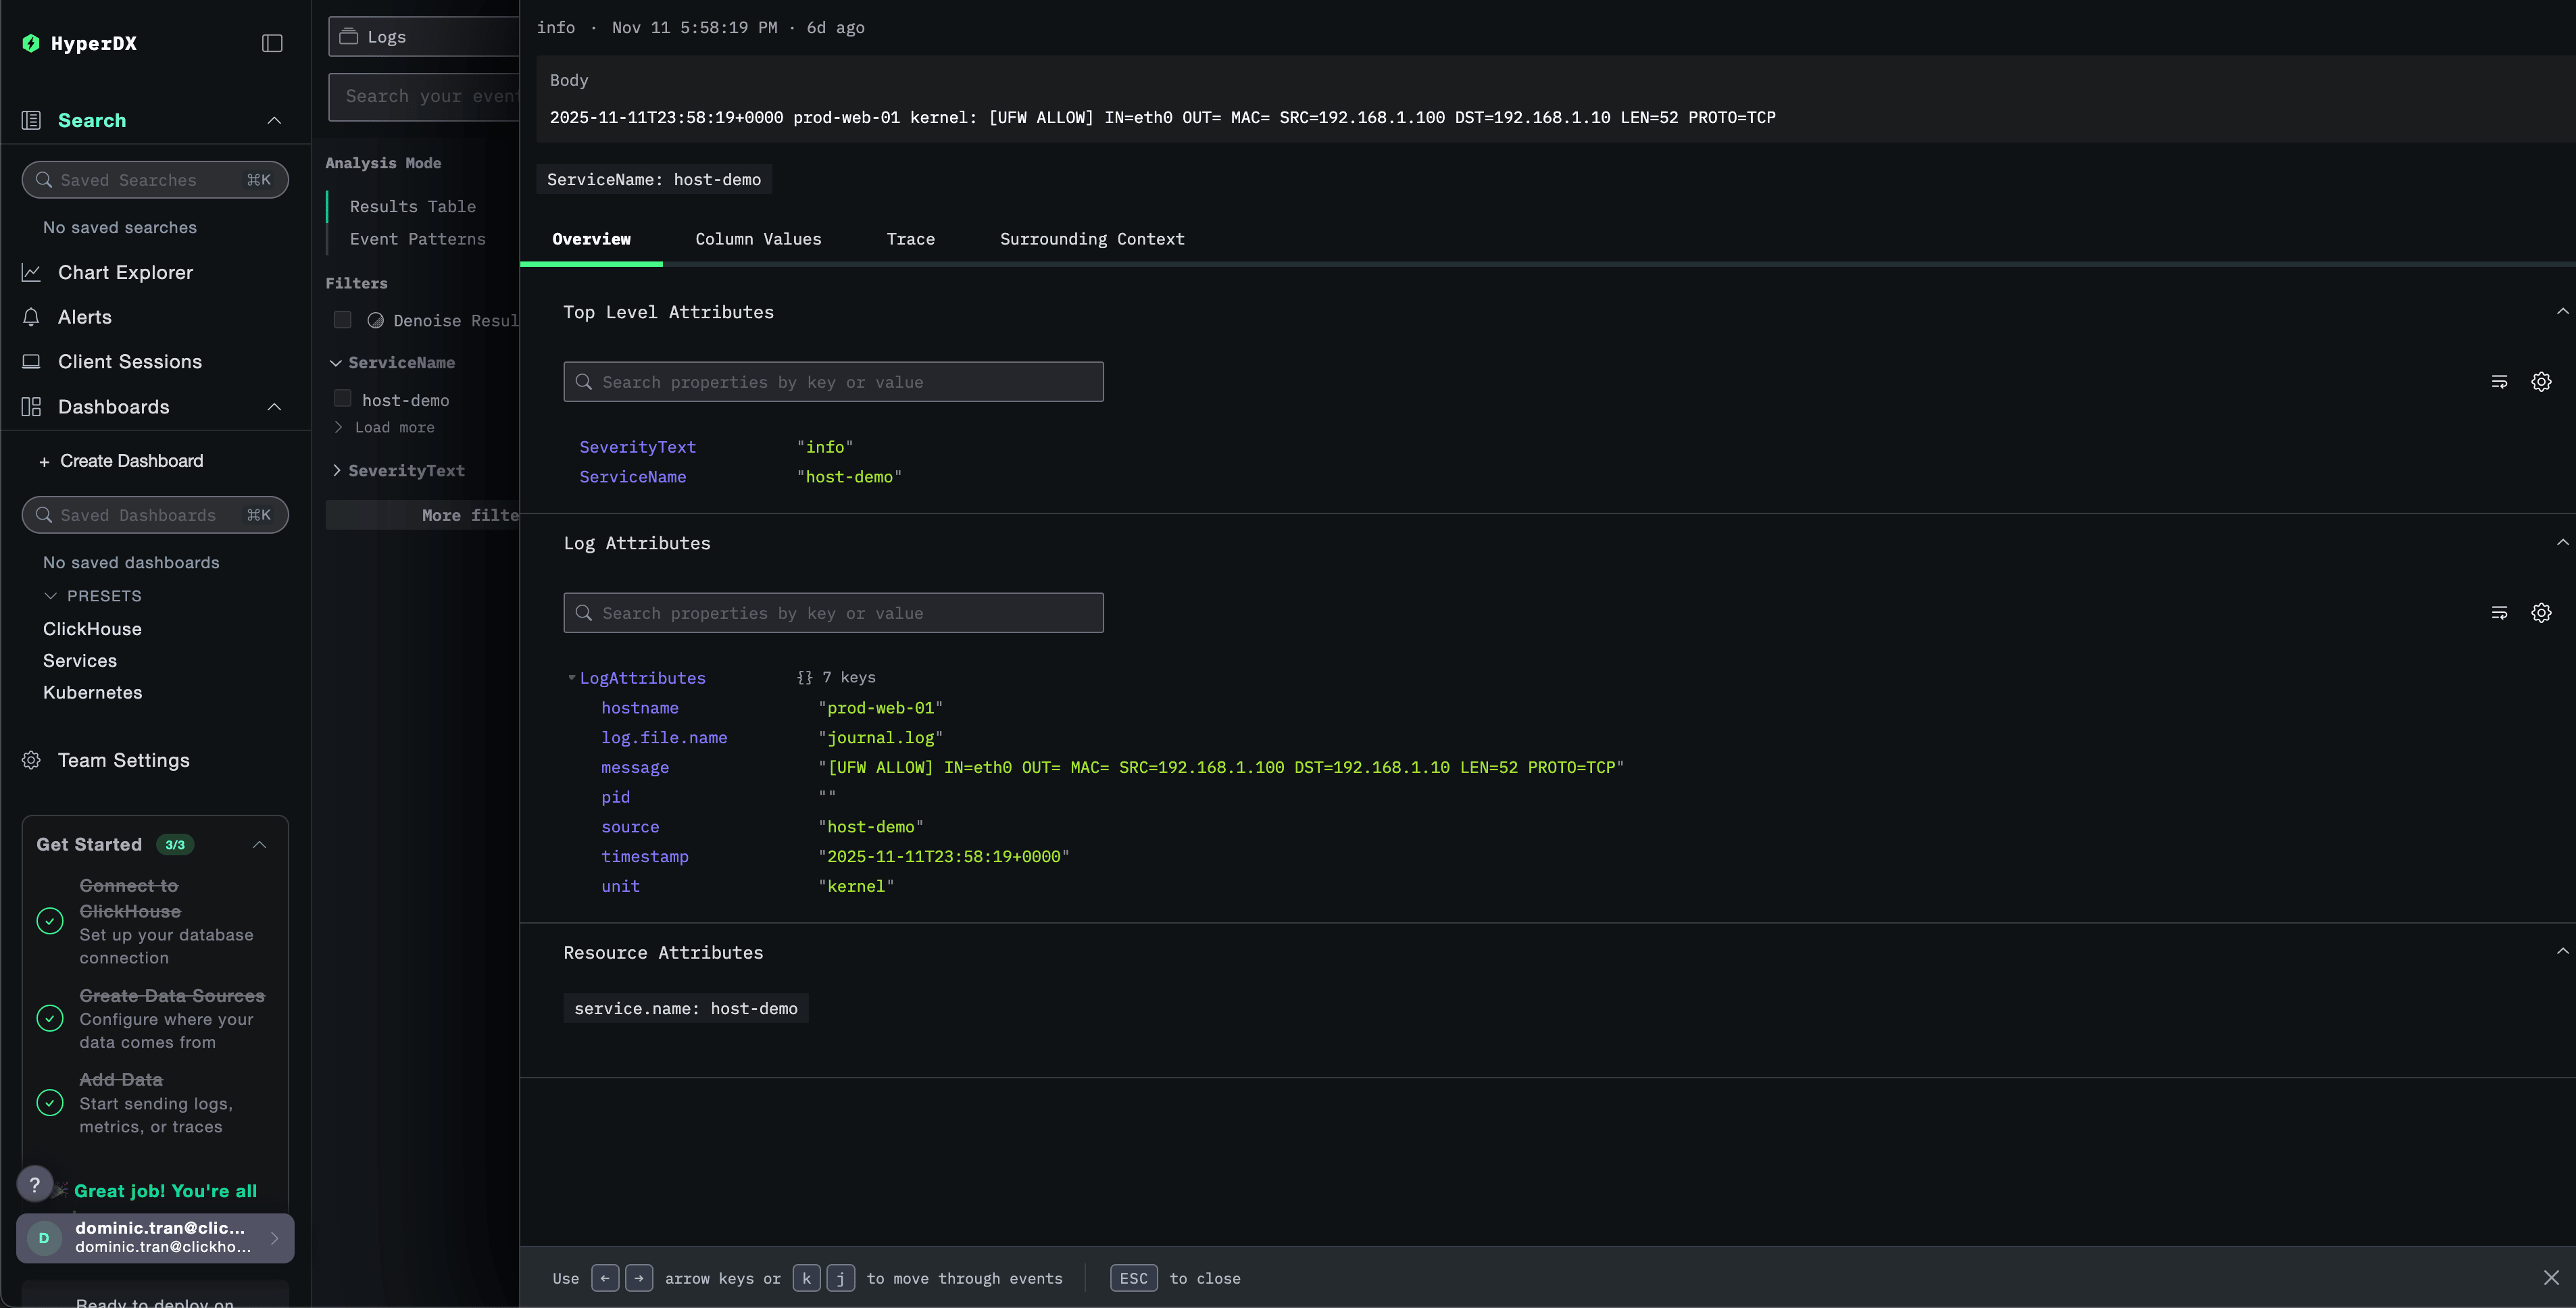
source:host-logsto see host-specific logs - You should see structured log entries with fields like
unit,hostname,pid,message, etc.
Demo dataset
For users who want to test the host logs integration before configuring their production systems, we provide a sample dataset of pre-generated system logs with realistic patterns.
Download the sample dataset
Download the sample log file:
curl -O https://datasets-documentation.s3.eu-west-3.amazonaws.com/clickstack-integrations/host-logs/journal.logThe dataset includes:
- System boot sequence
- SSH login activity (successful and failed attempts)
- Security incident (brute force attack with fail2ban response)
- Scheduled maintenance (cron jobs, anacron)
- Service restarts (rsyslog)
- Kernel messages and firewall activity
- Mix of normal operations and notable events
Create test collector configuration
Create a file named host-logs-demo.yaml with the following configuration:
cat > host-logs-demo.yaml << 'EOF'
receivers:
  filelog/journal:
    include:
      - /tmp/host-demo/journal.log
    start_at: beginning
    operators:
      - type: regex_parser
        regex: '^(?P<timestamp>\S+) (?P<hostname>\S+) (?P<unit>\S+?)(?:\[(?P<pid>\d+)\])?: (?P<message>.*)$'
        parse_from: body
        parse_to: attributes

      - type: time_parser
        parse_from: attributes.timestamp
        layout: '%Y-%m-%dT%H:%M:%S%z'

      - type: add
        field: attributes.source
        value: "host-demo"

      - type: add
        field: resource["service.name"]
        value: "host-demo"

service:
  pipelines:
    logs/host-demo:
      receivers: [filelog/journal]
      processors:
        - memory_limiter
        - transform
        - batch
      exporters:
        - clickhouse
EOF
Run ClickStack with demo configuration
Run ClickStack with the demo logs and configuration:
docker run --name clickstack-demo \
  -p 8080:8080 -p 4317:4317 -p 4318:4318 \
  -e CUSTOM_OTELCOL_CONFIG_FILE=/etc/otelcol-contrib/custom.config.yaml \
  -v "$(pwd)/host-logs-demo.yaml:/etc/otelcol-contrib/custom.config.yaml:ro" \
  -v "$(pwd)/journal.log:/tmp/host-demo/journal.log:ro" \
clickhouse/clickstack-all-in-one:latestVerify logs in HyperDX
Once ClickStack is running:
- Open HyperDX and log in to your account (you may need to create an account first)
- Navigate to the Search view and set the source to
Logs - Set the time range to 2025-11-10 00:00:00 - 2025-11-13 00:00:00
Dashboards and visualization
To help you get started monitoring host logs with ClickStack, we provide essential visualizations for system logs.
Download the dashboard configuration
Import the pre-built dashboard
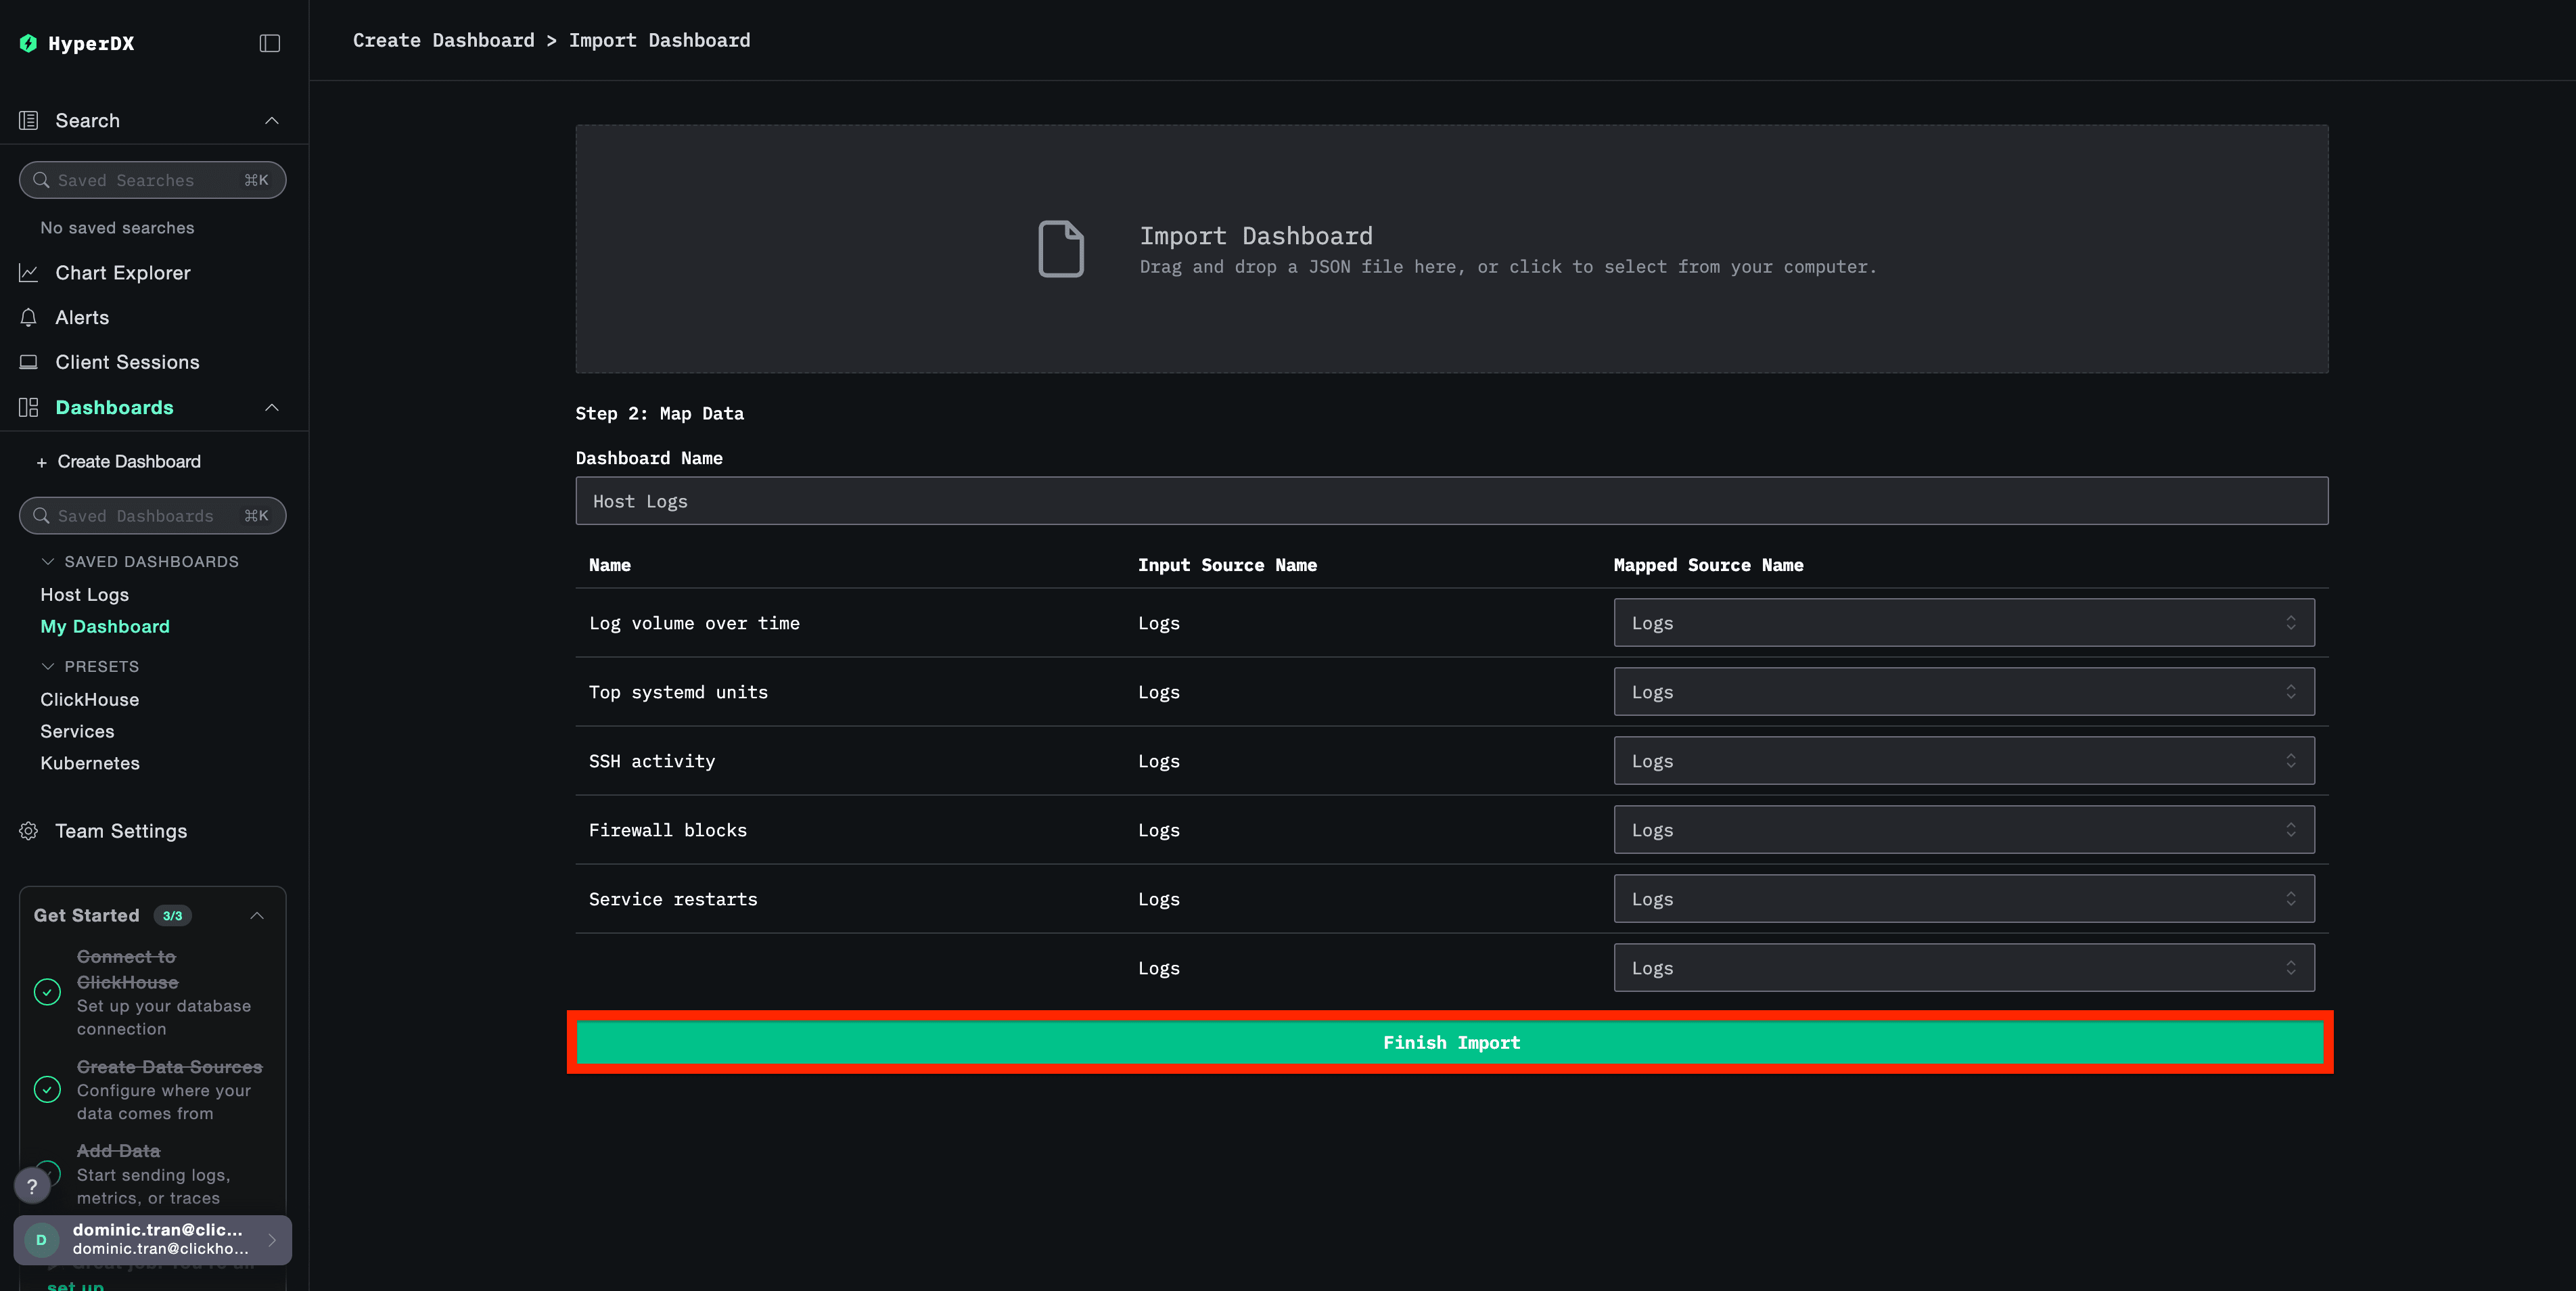
- Open HyperDX and navigate to the Dashboards section
- Click Import Dashboard in the upper right corner under the ellipses

- Upload the
host-logs-dashboard.jsonfile and click Finish Import
View the dashboard
The dashboard will be created with all visualizations pre-configured:
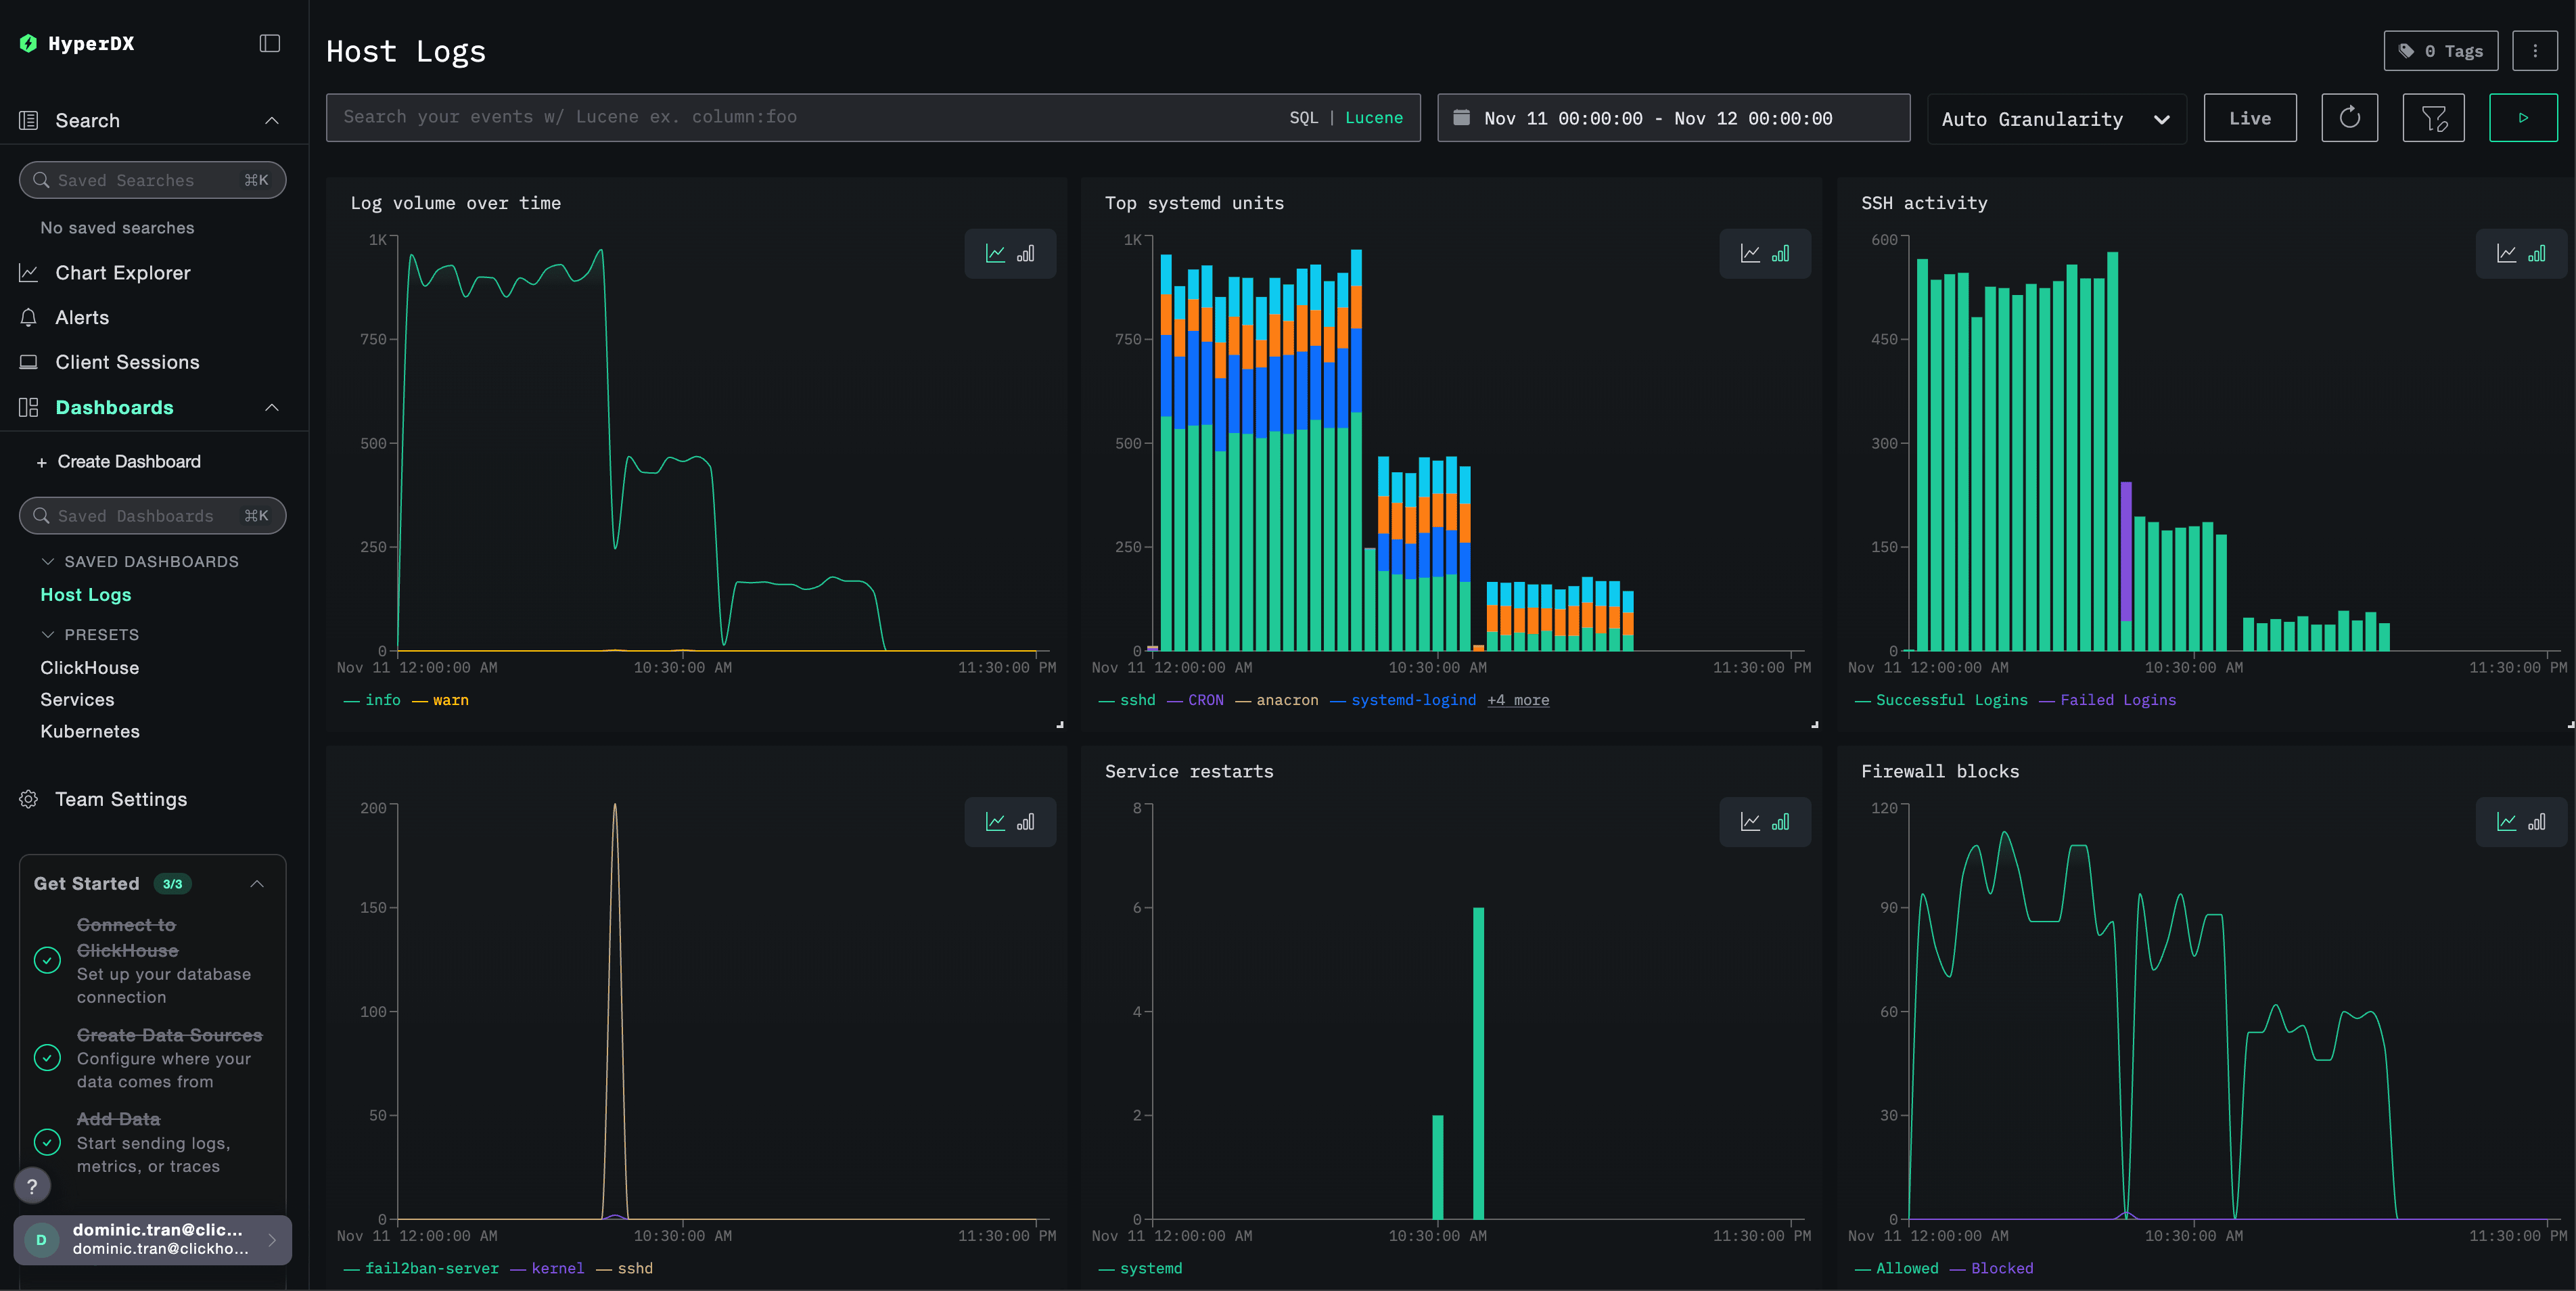
Key visualizations include:
- Log volume over time by severity
- Top systemd units generating logs
- SSH login activity (successful vs failed)
- Firewall activity (blocked vs allowed)
- Security events (failed logins, bans, blocks)
- Service restart activity
Troubleshooting
Custom config not loading
Verify the environment variable is set:
docker exec <container-name> printenv CUSTOM_OTELCOL_CONFIG_FILECheck the custom config file is mounted and readable:
docker exec <container-name> cat /etc/otelcol-contrib/custom.config.yaml | head -10No logs appearing in HyperDX
Verify syslog files exist and are being written:
# Check if syslog exists
ls -la /var/log/syslog /var/log/messages

# Verify logs are being written
tail -f /var/log/syslog
Check the collector can read the logs:
docker exec <container> cat /var/log/syslog | head -20Check the effective config includes your filelog receiver:
docker exec <container> cat /etc/otel/supervisor-data/effective.yaml | grep -A 10 filelogCheck for errors in the collector logs:
docker exec <container> cat /etc/otel/supervisor-data/agent.log | grep -i "filelog\|syslog"If using the demo dataset, verify the log file is accessible:
docker exec <container> cat /tmp/host-demo/journal.log | wc -lLogs not parsing correctly
Verify your syslog format matches the configuration you chose:
For Modern Linux (Ubuntu 24.04+):
# Should show ISO8601 format: 2025-11-17T20:55:44.826796+00:00
tail -5 /var/log/syslog
For Legacy Linux or macOS:
# Should show traditional format: Nov 17 14:16:16
tail -5 /var/log/syslog
# or
tail -5 /var/log/system.log
If your format doesn’t match, select the appropriate configuration tab in the Create custom OTel collector configuration section.
Next steps
- Set up alerts for critical system events (service failures, authentication failures, disk warnings)
- Filter by specific units to monitor particular services
- Correlate host logs with application logs for comprehensive troubleshooting
- Create custom dashboards for security monitoring (SSH attempts, sudo usage, firewall blocks)
Going to production
This guide extends ClickStack’s built-in OpenTelemetry Collector for quick setup. For production deployments, we recommend running your own OTel Collector and sending data to ClickStack’s OTLP endpoint. See Sending OpenTelemetry data for production configuration.